CHANCE News 11.05
|
 |
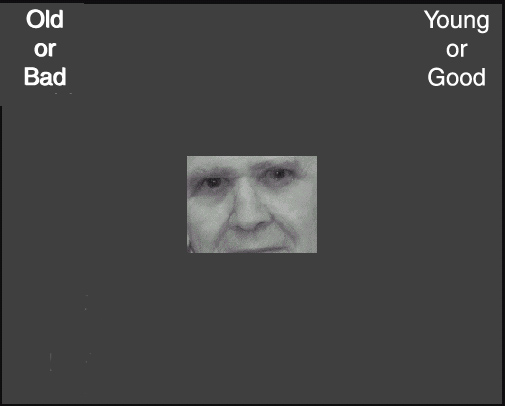 |
For the first picture you would hit the "i" key indicating the upper right corner since joy is good and for the second you should hit the "e" key indicating the upper left corner since the picture is of an old man.
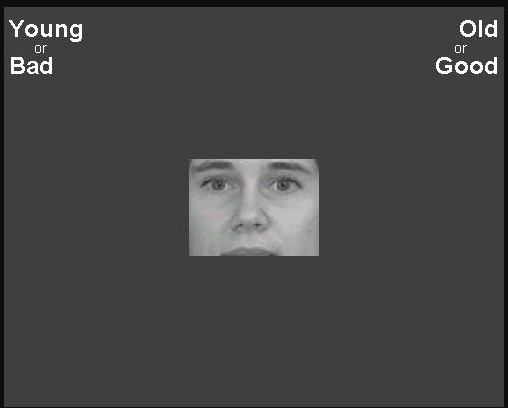
Here are two pictures you might encounter for the "young is bad and old is good" sequence.
 |
 |
In both of these you should hit the "e" key since the first picture is of a young man and in the second picture evil is bad.
Under the null hypothesis, that the subject has no preference for young over old, the responses rates for these two sequences of pictures should be the same. If the response rates for the "young is good and old is bad" sequence if faster than that for the "young is bad and old is good" sequence, this is taken as an indication of a bias in favor of young people. The "IAT effect" is the difference between these two response rates. The authors measure the overall effect of a preference for young over old by by "Cohen's d" which is the difference of the response rates divided by the standard deviation of the response rate. In (2) the authors present the following graph:
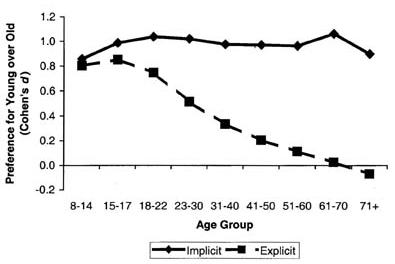
Implicit and explicit attitudes toward young versus old by respondent age. Positive Cohen's ds reflect a preference for young over old; negative values reflect a preference for old over young.
Note that the preference for young over old is relatively uniform until you reach 70 when you start enjoying your older colleagues. Also we can see, rather dramatically, the need for an implicit measure from this graph.
The Globe article reports that the authors were quite surprised by the fact that even older people do not particularly like older people. It is suggested that old people don't consider themselves old. Jacob Alden, a 73-year-old retired scrap metal dealer is quoted as saying:
When I turned 60, I said to myself, "70 is old." When I turned 70, I said, "80 is old." And if I turn 80, I will say, "90 is old." That is the way us old-timers think.
Our own favorite quotation was attributed to Wallace Matsen author of "Old is Not a Dirty Word'"
When you grow old, these idiot sociologists just keep sticking you in buses and taking you to see the fall colors.
DISCUSSION QUESTIONS:
(1) The authors of the internet study say that they are well aware of the problems involved in such studies. What do you think these problems are? What would be the advantage of internet studies?
(2) Try the IAT test on the web for one of the biases they test and comment on what you thought of the test.
References (Additional references and full text of articles are available here.)
(1) Hummert, M. L., Garstka, T. A., O'Brien, L. T., Greenwald, A. G., Mellott, D. S. (2002). Using the Implicit Association Test to measure age differences in implicit social cognitions. Psychology and Aging, 17, 482-495.
(2) Greenwald, Nosek, and Banaji, Harvesting implicit group attitudes and beliefs from a demonstration web site, Group Dynamics: Theory, Research, and Practice, 2002, Vol. 6, No.1, 101-115
(3) Greenwald, A. G., McGhee, D. E., & Schwartz, J. K. L. (1998). Measuring individual differences in implicit cognition: The implicit association test. Journal of Personality and Social Psychology, 74, 1464-1480.
Study links workloads of nurses to patient risk.
Boston Globe, 23 October 2002, A1
Anne Barnard
Hospitals nationwide are experiencing a 10 to 20 percent shortage of nurses. Naturally, this creates an increased patient load for the nurses who are available. Actually, nurses have been arguing for decades that this is dangerous for patients and can lead nurses to professional burn-out. The article notes that day care centers and airlines have minimum staffing requirements and nurses feel their situation should be handled similarly. Nevertheless, in 1996 the Institute of Medicine determined there was not sufficient evidence to require any policy changes.
However, a University of Pennsylvania research team has recently published a major study in the Journal of the American Medical Association (1) , looking at the relationship between nurses' workloads and patient outcomes. The investigators surveyed 10,184 nurses; this is half of all working nurses in Pennsylvania. The respondents' experiences covered some 230,000 patients. The study looked at mortality and serious complications such as infections 30 days after surgery. Analysis of these data showed that adding an extra surgical patient to a nurse's load was associated with a 7% increase in mortality risk.
California health officials recently proposed that hospitals be required to maintain a 1 to 6 nurse-patient ratio for surgical cases, with a 1 to 1 ratio in intensive care units. But hospitals argue that such hard and fast quotas deny them the flexibility needed to best allocate their resources. In any case, it is not clear where the extra nurses would come from.
DISCUSSION QUESTIONS:
(1) According to the article, the response rate to the survey was 50%. Should we be concerned about the interpretation of the results?
(2) A paragraph the end of the article expands on the findings. It states that "when nurses were caring for six patients instead of four, there were an additional 2.3 deaths per 1,000 patients; for patients with complications, there were an extra 8.7 deaths per 1,000. When nurses handled eight patients instead of four, there were 18.2 extra deaths per 1,000 patients with complications." How does any of this square with the 7% figure cited above?
References:
(1) Why this hospital nursing shortage is different, Howard S. Berliner, Eli Ginzberg, JAMA, December 4, 2002--Vol 288, No. 21.
Fear may be overwhelming, but so are the odds.
USA Today, 18 October 2002, 6A
Mark Memmott
Beltway anxiety; When risk ruptures life.
New York Times, 20 October, 2002, Sect. 4, p. 1
Sheryl Gay Stolberg
These articles address the public's perception of the risk of becoming a victim of the Washington DC sniper (both were written before the suspects were apprehended). In the two weeks leading up to the USA Today story, four people had been shot while putting gas in their cars. Many area citizens concluded that buying gas was unsafe. Still, an estimated 7 million gasoline purchases were made during the two weeks in question, which makes the shooting risk seem minimal. To show that driving remains a much more risky activity than filling up, the article notes that a metropolitan area the size of DC (roughly 5 million people) can regularly expect 25 traffic deaths during a two week period. The article concludes with a familiar sounding list of death risks from causes ranging from homicide to falling out of bed.
The New York Times article contains comments from a number of statistics experts. Their views call into question the usefulness of such lists. Baruch Fischhoff of Carnegie Mellon University cautions that it is not possible to exactly quantify the sniper risk. For example, he says commentators should not casually assert that the risk is smaller than that of being struck by lightning: "If the risk is a death per day for the foreseeable future, that's a much bigger risk than the risk of dying from lightening."
George Gray of Harvard University recently collaborated on a book entitled "Risk: A Practical Guide for Deciding What's Really Safe and What's Really Dangerous." Gray says that people react strongly when an unfamiliar risk suddenly gets wide publicity. As examples, he cites the recent anthrax scare, the shark attacks two summers ago, and last summer's child abductions.
The article observes that people tend to look for patterns in an attempt to explain frightening incidents. In this respect, the sniper seemed determined to cultivate fear. Each time a tendency was reported, his targets seemed to change.
The article ends on a note of irony. It quotes Melvin Lerner, emeritus professor of psychology at Waterloo University, who recommends combating fear by getting "as much information as you can about the true probability". When informed that many experts didn't think the true probability for the sniper could be estimated, he replied that "you just raised my anxiety enormously."
DISCUSSION QUESTIONS:
(1) What do you think of the comparison in USA Today between the risk of driving and the risk of filling up? Is number of deaths per time period the right measure, or can you propose a better way?
(2) Do you think that knowing the "true probabilities" in an unfamiliar situation generally calms the public?
Marilyn vos Savant has tackled easier problems lately.
Ask Marilyn.
Parade Magazine, 15 December 2002
Marilyn vos Savant
Marilyn responds to the following question:
A little girl has two tiny bags of jelly beans. Each bag contains two red jelly beans and two yellow ones. She loves yellow jelly beans. If she reaches in the bags and takes out one jelly bean from each, what are the chances that she'll get at least one yellow jelly bean?
Gary Zerlin, Bakersfield, Calif.
Marilyn's answer:
The chances are 3 out of 4 that she will get at least one yellow bean. And, oddly, the chances are also 3 out of 4 that she will get at least one red bean!
We wonder if Marilyn would have felt it would be less odd if these two probabilities were different!
Marilyn is also asked the following question which we thought might amuse our readers who are teachers even though it is not a statistics question.
On a geometry test, Mary devises a set of steps to solve a problem. Her solution is shorter and more elegant than the method that she was taught in class. If you were her teachers, how would you score Mary's answer?
Zina Yost Ingle, Vineland, N.J.
Marilyn's answer to this is:
I'd ask her to solve the problem by the method that was taught. If she could, I would give her full credit plus extra credit for the extra solution. If she could not, I would give her no credit at all. She doesn't understand what was taught in class. Methods of teaching are not necessarily the shortest and most elegant. Instead, they may simply be a good way for students to learn the principles of the subject.
DISCUSSION QUESTIONS:
(1) What do you think about Marilyn's answer to the geometry problem?
(2) Marylin's answer to the bean problem reminded us of a comment made in an article in the American Scientist (1) on estimating the danger of flying as compared to driving:
The probability of a fatality on a one-stop (two segment) flight is just two times the probability of becoming a fatality on a one-segment flight. (In actuality, because one must survive the first segment to become a fatality on a two segment flight, the full probability calculation is more complicated. But given the very low probabilities involved here, the simple approximation is quite accurate.)
Laurie commented to his colleague Dana that this is not all that complicated since the probability of dying on the two segment flight is just the sum of the probability of dying on the first flight and dying on the second flight minus the probability of dying on both flights. Dana replied "I think my probability of dying on both segments is pretty low. There must be something wrong with your computation."
Was there something wrong with Laurie's computation?
References:
(1) "Flying and driving after the September 11 attacks", Michael Sivak and Michael J. Flannigan, American Scientists, January-February 2003, pp 6-9.
Unconventional wisdom: Talk that matters.
Washington Post, 27 October 2002, B5
Richard Morin
At a recent meeting of the American Political Science Association, Adam Lawrence of the University of Pittsburgh presented intriguing findings about the power of president to set the national agenda. Lawrence examined the State of the Union addresses delivered between 1946 and 2002, making note of every issue the president raised. He then looked at the results of the Gallup polls, which regularly asks respondents to identify the most important problem facing the country.
Lawrence's analysis found that every 50 words spent on a particular issue in the address translated into a 1.5 percentage point increase in the number of people ranking that issue as the nation's number one problem. Presidents were apparently even more effective at taking problems off the public's mind. Every 50 words taking credit for solving a problem translated into a 6 percentage point drop in the number viewing it as the top problem.
DISCUSSION QUESTION:
The article notes that Lawrence had to account for actual events that might have shaped public sentiment. For example, news about the stock market or unemployment obviously influence people's level of concern about the economy. How do you think Lawrence could go about accounting for such factors?
A couple's work: Study says unmarried couples
split chores better.
Boston Globe, 9 November 2002, B1.
Patricia Wen
How equitably do today's couples divide household chores? It seems to depend on whether or not the couple is married. Sociologists point out that marriage still carries heavy social expectations, pushing women into more traditional roles. Data from a University of Maryland study this year were consistent with patterns observed in many other studies over the years. It found that married women spend an average of 18 hours a week on housework, compared with only 10 hours for their husbands. Moreover, this was using what is described as a "liberal" definition of housework that included yard work and car maintenance as well as daily chores.
Other studies have looked at cohabiting couples. The findings have generally shown more equitable divisions of household work, although women still tend to do more. Sociologist Philip Cone of the University of California at Irvine says that women who seeking equity in chores are well-advised to live with a man before marrying him. He published research to support this view in the August issue of the Journal of Marriage and Family: husbands who had a cohabitating stint did 34% of the chores, compared to 30% for husbands who went straight into marriage.
DISCUSSION QUESTIONS:
(1) The article summarizes data from another study that compared 7000 married and unmarried couples. Married women did approximately 71% of the housework, while unmarried women living with men did 67%. What do you make of the magnitude of the difference (here and in Cohen's work?). How would you describe its practical significance?
(2) The article raises the point that men who cohabitate may be less traditional to begin with, and that this attitude might explain their different approach to chores. But it goes on to say that Cohen "believes his study shows that men who live with women become trained in the rules of cohabitation, and bring that pattern into the marriage." How do you think the study might have made that distinction?
The next article deals with the arrest of three computer wizards charged with manipulated horse racing bets to win over 3 million dollars. As reported in the news, the evidence was circumstantial and did not seem completely convincing to us. We thought that if they put their trust in statistics they might be able to persuade a jury that they were not guilty beyond all reasonable doubt. Alas, one of the three decided that it was better to accept a plea bargain, so statistics may not be able to save them.
All bets are off after Breeder's Cup racing fix.
The Dallas Morning News, 15
November, 2002
Gary West
One normally thinks of horse race bets as bets that a specific horse will win, or will place (come in first or second), or will show (come in first, second, or third) or a "daily double" bet that a specific pair of horses will be the winners of two races.
In recent years, race tracks have introduced new forms of bets which are more like lotteries, called "exotic bets." These bets typically involve picking the winners of 3 or more races and have large prizes for success. This article deals with a "Pick Six" bet at the annual Breeders' Cup races, held on October 26th at Arlington Park. The Breeders' Cup races are sponsored by the National Thoroughbred Racing Association (NTRA) and are considered the "all star game" of horse racing because they attract the best racing horses throughout the world.
This year, the Breeders' Cup had 8 races and the Pick Six bet related to the last six races. A Pick Six ticket costs $2 and requires that you select a winner for each of the six races. You win if all six of your picks win their respective races. If you get only five correct you get a consolation prize. The pool for the prizes is obtained from the money collected from the Pick Six bets. The NTRA guarantees that it will be at least 3 million dollars.
The payoffs to winning tickets are determined as follows. Suppose that the total amount taken in by Pick Six bets is B. Then the NTRA takes 25% (1/4B) for themselves. The remaining 75% (3/4B) is again divided with with 75% (9/16B) to be divided among the Pick Six winners and 25% (3/16B) to be divided among those who got five correct as consolation prizes.
This year the amount taken in from Pick Six bets was $4,569,515. The track took its 25% leaving $3,427,136 to be returned to the bettors. Taking 75% of this gave $2,570,352 to be divided among the winners and the remaining 25%, or $856,784, to be divided among those who got 5 correct. For this years race 6 winning tickets were sold and 186 tickets were sold that got five correct. Thus each winning ticket got $428,392 and each consolation ticket $4,606.20.
The winning six tickets were all bought by the same bettor, Derrick Davis, owner of a computer business in Baltimore. Davis specified the winners for the first four races and then chose every possibility for the 5th and 6th races. There were 8 horses running in the 5th race and 12 in the 6th, so Davis had to buy 8x12 = 96 tickets to cover all possibilities for the 5th and 6th race. This would assure that he would have a winning ticket if his choices for the first 4 races were correct. He actually bought 6 of these sets of 96 costing him $1152. This assured him a bigger fraction of the money designated for the winners money if he did win. His picks for the first four races all won, so he ended up with 6 winning tickets. It turned out that there were no other winning tickets so he qualified for the entire winners' money, $2,570,352. He also had 108 tickets with five correct. This qualified him for a total winning of $3,067,820.
The NTRA was suspicious about these bets. They thought it strange that a bettor would make six replications of the same set of tickets and also put all the money on a single choice of winners for the first 4 races. Their investigation led them to look into Davis' past. They found that he had two friends, Glen DaSilva and Chris Harn, who were fraternity brothers when the three of them were in college at Drexel University. The investigation led to the three friends being charged with fraud and Davis' winnings being held up. Here is the basis for this charge.
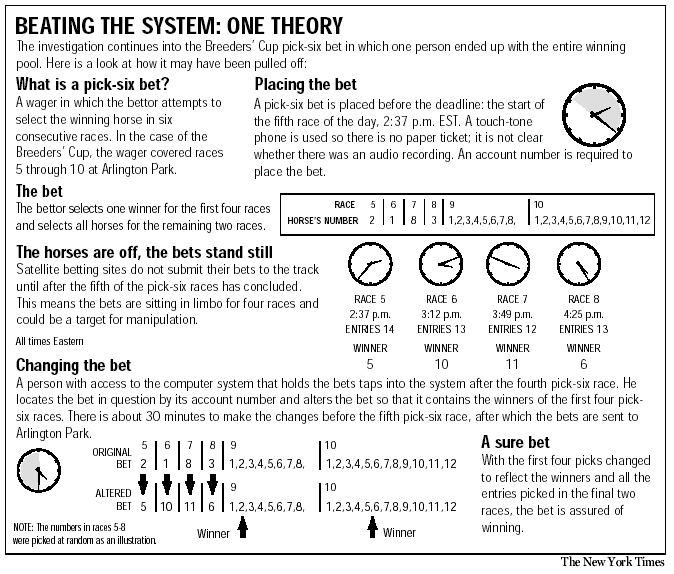
Chris Harn was a computer expert who worked for Autotote company which processes a large proportion of the race track bets. To avoid computer congestion at the race track, only the bets that are still possible winners after the first four races are sent on to the track. They are sent after the fourth race and before the beginning of the fifth race. Harn had access to the betting data and is charged with changing the bets on the first four horses to make them agree with the winners before they were sent on to the track. The Dallas Morning News web site provided the following nice graphic to show how this could have happened:
Harn is also accused of performing the same service for DaSilva, who
won $1,851.20 in a Pick Four wager at Baltimore Park on Oct. 3, and
$105,916 in a Pick Six bet at Belmont Park on Oct. 5. DaSilva used the
same strategy of picking single winners in the early races and then
every horse in later races. Harn, Davis, and DaSilva were charged with
fraud under Title 18 Section 1243 of United States Code.
Section 1343. Fraud by wire, radio, or television Whoever, having devised or intending to devise any scheme or artifice to defraud, or for obtaining money or property by means of false or fraudulent pretenses, representations, or promises,
transmits or causes to be transmitted by means of wire, radio, or television communication in interstate or foreign commerce, any writings, signs, signals, pictures, or sounds for the purpose of executing such scheme or artifice, shall be fined under this title or imprisoned not more than five years, or both. If the violation affects a financial institution, such person shall be fined not more than $1,000,000 or imprisoned not more than 30 years, or both.
The US Attorney who brought the charges claims that phone records showed that Harn was communicating on his cell phone with Davis during the time the Breeders' Cup races were going on and computer records show that Harn came to Autototes's headquarters, even though he was not scheduled to work, and electronically accessed the computer file that held Davis' wager.
We wondered what evidence the defense attorney could give to combat this rather impressive circumstantial evidence. For starters we thought he might try claiming that Davis just wanted Hahn to check to make sure his bet was actually received. As to how strange his bet was, we wondered what systems were used and how often it happens that there is at most one winner in the Pick Six bet. The Pick Six bet for the Breeders' Cup races has only been available since 1997. Here are the numbers of winners and the payoff information for the races up to 2002.
|
Year
|
No. of winning tickets
|
Pool
|
Payoff for winning ticket
|
|
1997
|
115
|
3,379,014
|
16,417.20
|
|
1998
|
114
|
6,494,193
|
34,607.20
|
|
1999
|
1
|
5,436,691
|
3,088,138.60
|
|
2000
|
68
|
5,123,453
|
45,772
|
|
2001
|
11
|
4,811.450
|
262,442
|
|
2002
|
6
|
4,569,515
|
428,392
|
Table 1. Number of winning tickets and payoff for Breeders' Cup races 1997-2002.
Thus we see that their lawyer would have a precedent. In 1999 G. D. Hieronymous--a videographer with a Breeders' Cup newsfeed team-- held the only winning ticket for the Pick Six bet. He created a strategy for a group of his fellow workers. His strategy was to pick two horses in the first and second races, three in the third race, and two in the last two races that he thought had a good chance to win. Thus he had to bet on 2x2x3x2x2x2 = 96 possible outcomes which cost him $192. He had the only winning ticket and won $3,088,138.60.
To compare his strategy to that used by Davis, we need to show how to evaluate a particular strategy for buying Pick Six tickets. For this we need to estimate the expected winning using a particular strategy.
We consider first how we might estimate the probability, before the race, that a particular Pick Six ticket is a winning ticket. It is reasonable to assume that the races are independent events, so we only need to estimate the probability that each of the horses picked win the races they are in.
Odds are given for the win bets so we can use these odds to estimate the probability that a particular horse wins a race. For example, if the odds given that a horse will win are 4 to 1, this corresponds to a probability of 1/5 that the horse will win.
We will find it useful to know how the track determines these odds. Here is a description, provided by our friend the "The Wizard of Odds", of how the odds for a "win" bet would be calculated for a particular horse, for example Longwind.
Assume that $1000 is bet on the "win" bets. The track takes its cut which is typically between 15 and 20 percent. Assume that it is 17%. This leaves $830. Now assume that $200 was bet on Longwind. Then the track divides 830 by 200 getting 4.15. It then returns $4.15 for each $1 dollar bet on Longwind if he wins. In this case the bettor wins $3.15 for every dollar bet on Longwind. This determines the odds on Longwind as 3.15 to 1. From this we estimate that the probability Longwind will win is 1/(1+3.15) = 1/4.15 = 200/830. If $300 were bet on another horse the probability that this horse would win is 300/830.
If we add these probabilities for all the horses, we get 1000/830 = 1.205 instead of the 1 we would expect from our estimates of the individual probabilities. So we have to normalize these probabilities to add to one by dividing them by 1000/830. When we do this the probability that Longwind wins is 200/1000 = 1/5. More generally, if b is the amount bet on a horse and B is the total amount bet on win bets then our estimate for the probability that this horse wins is b/B. Thus our estimate for the probability that a horse wins is just the proportion of money bet on this horse.
When the track publishes the odds, they normally round them off to one decimal place, rounding them down. This gives the track a little more money and makes our estimates using these odds not quite correct.
These probabilities, based on the amounts that the bettors bet on the horses, are subjective probabilities. How do we know they are reasonable estimates for the probability that a horse will win? Fortunately, Hal Stern has studied this question and was led to the conclusion that these subjective probabilities are really pretty good. As reported in Chance News 7.10, in his column "A Statistician Reads the Sports Pages" (Chance Magazine, Fall 1998, 17-21) Hal asked: How accurate are the posted odds? To answer this he considered data from 3,784 races (38,047 horses in all) in Hong Kong. He divided the range of odds into small intervals and for each interval found the proportion of times horses with these odds won their race. Here is a scatterplot of his results:
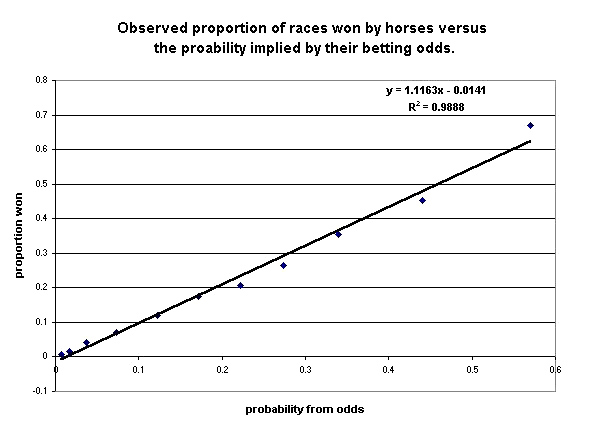
Figure 1. Correlation of the subjective estimates of the probability a horse will win with the empirical frequency that the horse wins.
As you can see the fit is remarkably good.
We return now to finding the probability, before the races begins, that a particular Pick Six betting strategy is successful and use this to find the expected winning for a particular strategy.
Assume first that we purchased a single Pick Six ticket. For this we specified a horse in each race that we think will win. As we have remarked, it seems reasonable to assume that the winners of different races are independent events. So from the posted odds for the races we can determine the probabilities for each horse winning and multiply these to get the probability that we have a winning ticket. For example, for a Pick Six bet in the 2002 Breeders' Cup races suppose we were to bet on the horse with the highest probability of winning in each race. We can find the relevant win bet odds from the NTRA web site. Using these we find the horses in each race with the highest probability of winning to be:
| Race | Horse | odds |
probability of winning |
| Mile | Rock of Gibraltar | .8 | .453 |
| Sprint | Orientate | 2.7 | .223 |
| Filly | Golden Apples | 2.8 | .217 |
| Juvenile | Whywhywhy | 2.5 | .236 |
| Turf | High Chaparral | .9 | .429 |
| Classic | Medaglia d'Oro | 2.7 | .222 |
| probability all win =.00049 |
Table 2. Data for determining the probability of winning a Pick Six bet on the
favored horses for the Breeders Cup 2002 races.
We see that for this bet we have a winning ticket with probability .00049. Using the probabilities for winning each race we find the probability of getting exactly 5 correct to be .0137.
We now show how we compute the expected winning for for a general strategy using multiple bets. Recall that if B is the total amount bet on Pick Six bets, (9/16)B is divided amount the winners and (1/16)B is divided amount those who got five correct.
Since the payoff depends on the number of bettors with winning tickets, to calculate the expected winning we have to know how many winning bets there are for each choice of 6 horses to win. However, in this year's races, there were 1,585,584 ways to choose six horses to win so it is not surprising that this information is not available from the NTRA web site. Thus we must estimate these numbers. We do this by estimating that the proportion of bettors who bet on a particular choice six horses is equal to the probability that these 6 horses win. This is what Hal showed was reasonable for the "win" bets. With this assumption we can compute the expected winning from a single ticket.
Assume now that we make a Pick Six bet. Let p be the probability that our choice of horses win and q the probability that our choice was wrong in just one race. Then, by our assumption, the number of bettors who bet as we did is pB and the number who bet on a choice that differs only by one from ours is qB. Thus if we win our payoff is (9/16)B/pB= (9/16)/p and if we get all but one correct it is (3/16)B/qB = (3/16)/q. So our expected winning is
E = p(9/16)/p + q(3/16)/q = 9/16 + 3/16 = 3/4.
Thus our expected payoff is 75 cents for each dollar spent on tickets and this is the same no matter which horses we choose for our ticket. Of course the expected winning is - 25 cents since we paid $1 for our ticket. Since the expected payoff for any bet is the same, the expected payoff for any strategy involves buying the same number of tickets. Thus Davis' lawyer could argue that his clients strategy was as sensible as any other strategy which involved buying the same number of tickets!
The fact that no strategy is any better than any other with the same number of tickets is rather surprising, so it is natural to ask how reasonable is our assumption that the proportion of bets on a specific choice of winners is equal to the probability that this choice wins. One can argue that horse racing bets are like buying stocks. If one could find a strategy for making money buying particular stocks, then others would do the same, and the price of the stock would go down. If a horse-racing wizard figured out a more favorable way to bet, others would learn of this and do the same making the winnings less and bringing the distribution of bets back to the equilibrium situation where no one has an advantage. On the other hand, one can also argue that, given the large sums of money one can win, bettors utility function might affect their betting. For example, more bettors might include a long shot, in the hopes that they will not have to share the winning.
It would be nice to have enough data to check this assumption, as Hal did for the "win" bet. Unfortunately, we do not have this data. We do have a very small amount of data where we can compare our predicted number with the actual number of tickets sold. News accounts typically give the number of the winning tickets. We found these numbers for the 6 years that the NTRA has had the Pick Six bet. Here is the comparison for these years.
| Year | Total amount B bet on Pick Sixs | Probability p before race the winning Pick Six would win. | Our estimate pB/2 for the number of winning tickets | Actual number of winning tickets |
|
1997
|
$3,379,014
|
0.0000350
|
59
|
115
|
|
1998
|
$6,494,193
|
0.0000204
|
66
|
114
|
|
1999
|
$5,436,691
|
0.0000012
|
3
|
1
|
|
2000
|
$5,123,453
|
0.0000105
|
27
|
68
|
|
2001
|
$4,811,450
|
0.0000055
|
13
|
11
|
|
2002
|
$4,569,515
|
0.0000005
|
1
|
0
|
Table 4. Comparing the umber of winning tickets with the number estimated.
The fit of the predicted values of tickets and the actual number of tickets is not great, but then it is not bad either and, as we know, six data values do not tell us much.
Note that the Breeder's cup officials have decided that there were no winners this year. This presumably means that the the 78 legitimate winners of the consolation prizes would divide the entire $3,427,136 that had been set aside for the Pick Six prizes. This would give them about ten times as much as they had won, $43,937.6 instead of $4,606.2. They can be identified since they had to sign a federal tax identification form to get the winnings.
Well, we did not succeed in our attempts to save our computer friends from time in jail but perhaps we provided an interesting example to use in your statistics courses.
Final note: By the time we finished this long treatise, all three of the fraternity brothers pleaded guilty and sentencing is scheduled for March 11.
DISCUSSION QUESTIONS:
(1) Do you think that statistics would have helped the fraternity brothers if there had been a trial?
(2) What differences are there in your expected winning with a Pick Six ticket as compared to a Powerball Lottery ticket? For an analysis of the expected winning for Power Ball lottery (prior to the latest change in how many numbers you draw from) click here.
A Chance course has been taught at Dartmouth since 1992. This year's course was taught in the Fall term by Elizabeth Brown and Greg Leibon and was a particularly successful course. A syllabus for the course and summaries of student projects can be found here. The course had a number of visiting lecturers and we will describe one of these here and the other two others in the next Chance News. All three lectures are available now from the Chance web site under Other Chance Lectures.
Risk and Revolution.
La Loterie de France 1759 - 1836
Stephen Stigler, University of Chicago
This was the first lecture in the Dartmouth Math Department's "Reese Prosser Lecture Series" designed to bring interesting mathematics to a general audience. Stephen Stigler is a distinguished statistician whose research and books on the history of statistics are classics. His most recent book "Statistics on the Table" (Harvard University Press 1999) is one of our favorite statistics books.
As the title suggests, this talk told the story of the French lottery which was started in 1759 at the suggestion of Giacomo Casanova. What follows is a brief summary of what Stigler told us in his lecture. You should listen to the lecture for the full story.
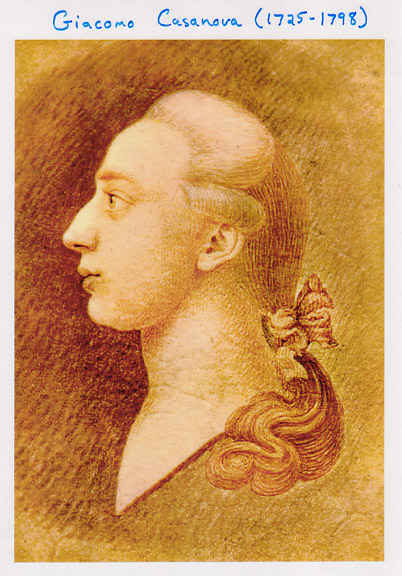
Giacomo Casanova
Stigler said that Casanova was an adventurer, soldier, priest who aspired to be the Pope, gambler, secret agent, and lover. He remarked that all these roles are well documented except for his role as a great lover -- accounts of this depending on self-reporting. Note that all these involved risk. Casanova once said:
To live and to gamble were to me two identical things.
Casanova spent some time in jail in Venice for having the wrong kind of books in his home but escaped from jail and went to Paris where he became a favorite of Parisian society. This led to his learning that the government wanted to raise money for its military school. Casanova recommended that they start a lottery. The officials thought this was a good idea so, with Casnaova's help, they designed a lottery quite similar to today's lotteries. Here is a description of the lottery.
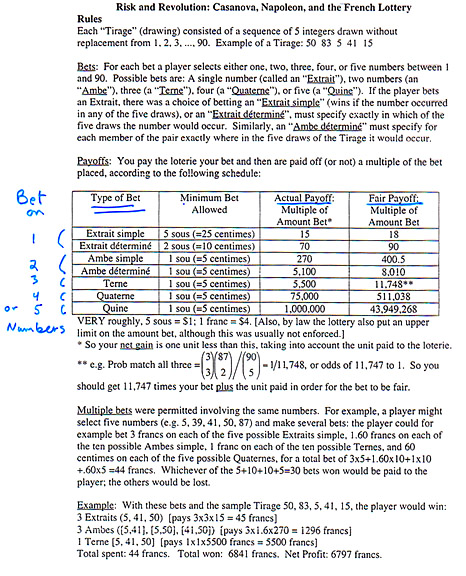
The French Lottery 1759-1836
Note that in this lottery, bettors can choose to bet on 1,2,3,4,or 5 numbers chosen from the numbers 1 to 90. It is also possible to make multiple bets using the same set of numbers.
In a modern lottery, such as the Powerball Lottery, you must choose 5 numbers from 1 to 53 and then another number from 1 to 42 called the"powerball number." How much you win depends on how many of these numbers agree with the five numbers drawn by the lottery. Here are the prizes and the odds.
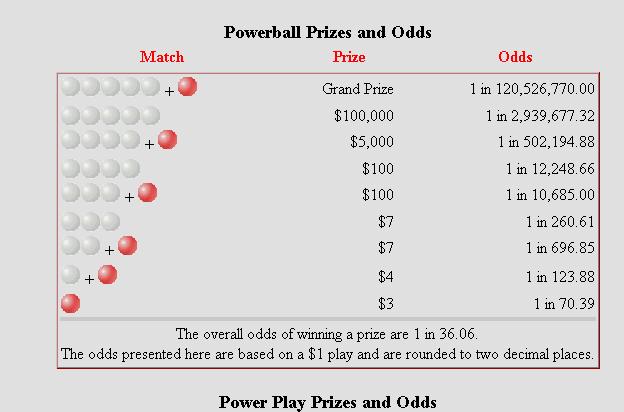
The Powerball Lottery is designed to assure that the lottery will keep about 50% of the money no matter what happens. For example, if there are several winners of the jackpot, they share the winning ($315 million as this is written). In the French lottery everyone who wins a Quine bet (a bet on five numbers) gets a million sous even if this breaks the bank. Indeed the government officials were worried about this, but Casanova told them it would be great if it happened since this would increase the number of people who would play the lottery and would get it all back!
Stigler said that his real interest in the lottery came when he ordered, sight unseen, a book about the lottery written in 1834 by M. Menut.

When he got it he was amazed to see that it had a huge amount of data on the lottery, much of which was handwritten. He realized that the data in the book would allow him to test whether the lotteries' winning numbers were randomly chosen. The winning numbers were chosen by putting wooden balls with numbers from 1 to 90 in a wheel and mixing them up. Then a boy picked the five winning numbers as illustrated in this picture:
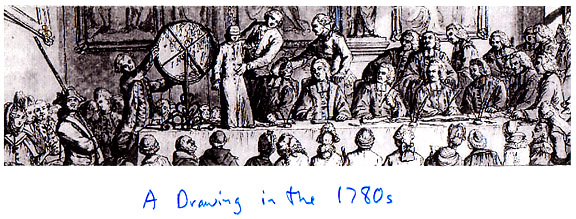
The lottery operated from 1758 to 1836 and the book had the winning numbers for 6606 lottery draws. For these numbers Stigler first plotted the frequency of each number from 1 to 90.

This looks pretty uniform and a Chi-Square test (adjusted for the fact that we are sampling without replacement) showed that he could not reject the hypothesis that they were randomly chosen.
But there remains the possibility that there is dependence between choices of numbers. Perhaps the numbers were not mixed properly so that 13 was more likely to be followed by 14 than some other number, say 78. To test this, Stigler resorted to the famous birthday problem. He considered the 43,949,268 possibilities for the five numbers that might be drawn as birthdays (say on planet Zoos where there are 43,949,268 days in the year). Then he asked how many people would you have to have in a town on Zoos to have a fifty percent chance of having two people with the same birthday. He found that the answer was 7,806. Thus with 6,606 sets of five numbers we would expect about one time to have the same set of five numbers drawn. That is exactly what happened with his data.
Stigler also observed that there were 233 pairs of drawings that agreed in four of their five numbers. He showed that the expected number of such pairs for 6606 drawings is 211 with standard deviation estimated to be 15. Thus again the observed number is not significantly different that the expected number.
Stigler next realized that he could also get some idea of which numbers were preferred by those who bought lottery tickets. Menut's book also included a list of all the big winners together with their winning numbers. This included one quine (all five correct) winner, 327 winning quaternes (four correct), and 3 large ternes (three correct and in the right order) for a total of 331 large bets. Assuming that the winning numbers were chosen randomly, as his earlier calculations suggested, these 331 winning numbers can be considered as a random sample of numbers chosen by the buyers. Stigler provides the following distribution of these numbers:
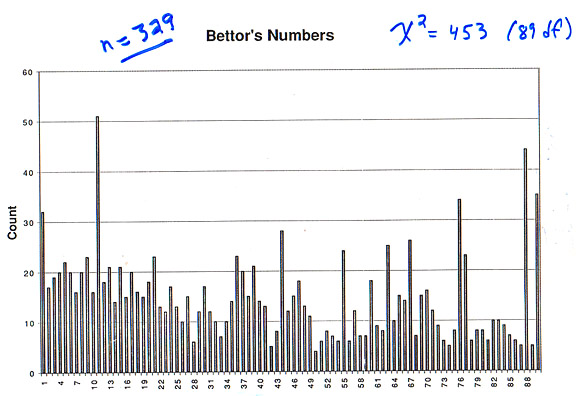
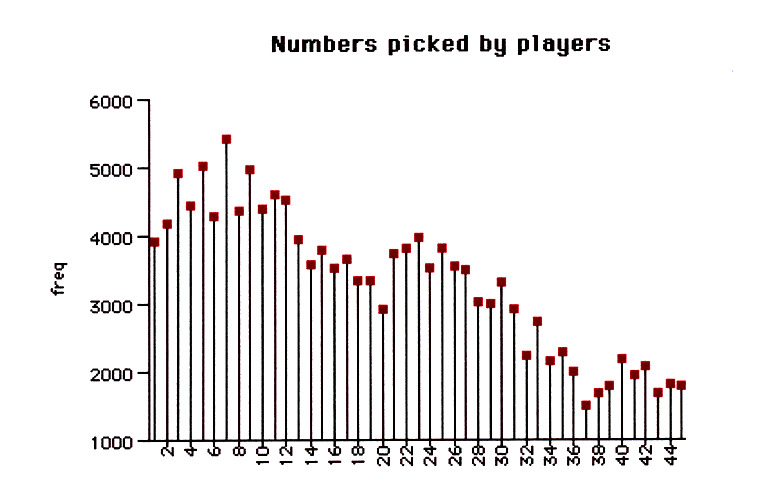
We note the well-known fact that people like to choose birthdays, so low numbers are more frequent than high numbers. Here is a similar graph for data from the Powerball Lottery in the 1990's, when buyers of lottery tickets chose numbers from 1 to 45:
We see the birthday effect even more strongly here. Note then 1 to 12 are the most frequent, perhaps because they can be used both for months and years. Then comes from 13 to 30, again for birthdays, and the remaining numbers are less popular. The French seemed to have more specific favorite numbers. In particular the numbers 11,22,33,44,55,66,77, and 88 are all very popular in the French lottery, but similar possible pairs 11,22,33,44 for the Powerball Lottery are not especially popular.
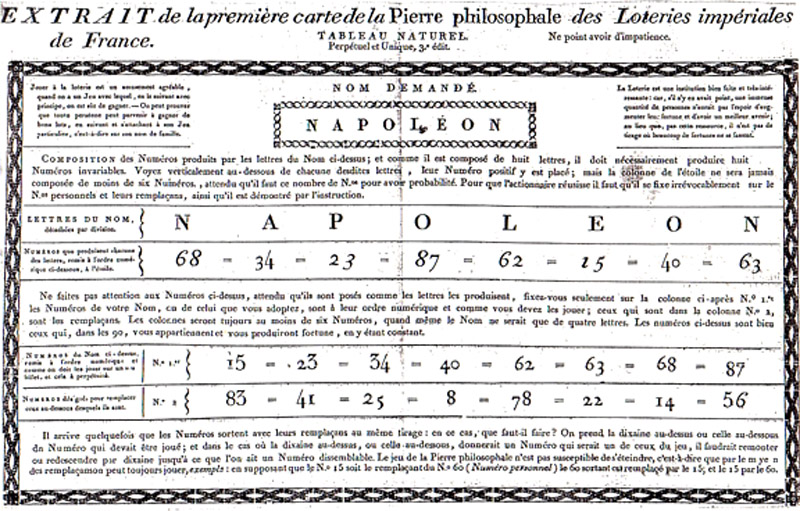
Stigler also spoke about where the French people got their numbers. One way was to associate numbers with letters A = 1, B = 2, C = 3 etc. and choose famous names such as Napoleon. An entrepreneur named J.B. Marseille who billed himself as a mathematician offered a complicated cryptological scheme to obtain sets of numbers based on the same name illustrated here:
Stigler observes that the existence of the lottery helped spread the word about the importance of probability at the time it was being developed. Those who sold lottery tickets had to know some basic combinatorics even to charge the right price for those who wanted to place complicated bets. Those who bet learned to understand what odds meant and how to interpret them.
One of the founders of modern probability, Pierre Simon Laplace argued in the Chambre des Pairs that the lottery was immoral because of the disadvantage it gave to those who played it. This was especially troublesome because of the large number of poor people who played the lottery. His argument did not prevail, but in 1836 the lottery was discontinues, not for morality reasons but because of declining interest.
Watch the movie for more about this fascinating history of the French lottery!
DISCUSSION QUESTIONS:
(1) Which lottery, the French Lottery or the Powerball Lottery, would you prefer to play?
(2) Do you think Laplace would have had any better luck arguing against the lottery today?
Bible Code II: The countdown.
Viking Press, 2002
Michael Drosknin
Sadly, despite all the debunking of the Bible Codes by Brenden McKay and his colleagues (documented here ), the Bible Codes refuse to go away.
Recall that the Bible Codes refer to the Torah, the first five books
of the Bible: Genesis, Exodus, Leviticus, Numbers and Deuteronomy. Those
who look for Bible Codes first eliminate all spaces in the Torah and
consider the text as one long sequence of about 300,000 letters. A computer
then looks for words with equal skips of letters called an an "equidistant
letter sequence," or ELS for short. They are displayed on a sequence
of rows where each row has the same number of letters. Then ELSs appear
as vertical, horizontal or slanted lines.
If you are not familiar with the Bible Code controversy we recommend you read the article: "The Torah Codes: Puzzle and Solution," Maya Bar-Hillel, Dror Bar-Natan, and Brenden McKay, Chance Magazine Vol. 11, No. 2, Spring 1998, pp. 13-19 available here.
Drosknin's "Bible Code II" begins with the September 11 tragedy. On the cover of the book we see the author's evidence that this tragedy was anticipated in the Bible.
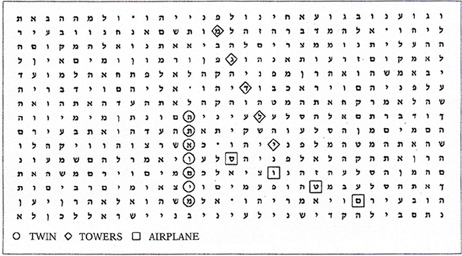
Readers of Chance News will recall the following challenge made by Michael Drosnin relating to his first book on the Bible Codes:
When my critics find a message about the assassination
of a prime minister encrypted in Moby Dick, I'll believe them.
Newsweek, Jun 9, 1997
McKay accepted the challenge and found messages about the assassination
of Indira Gandhi, Leon Trotsky, Martin Luther King, John Kennedy, Abraham
Lincoln and others in Moby Dick. You can see these messages here.
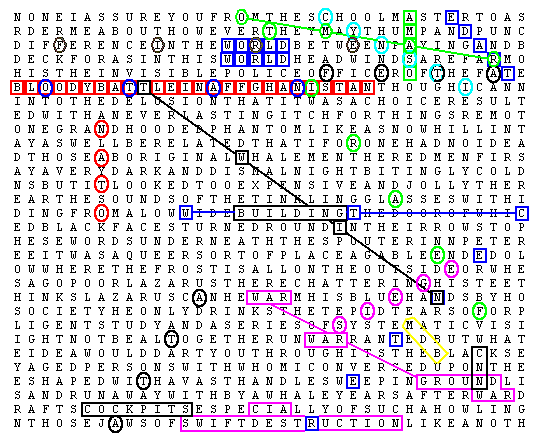
On October 8, McKay provided evidence that Moby Dick also predicted
the "War
on Terrorism" writing: Afghanistan is mentioned exactly once in Melville's
classic Moby Dick. Imagine our amazement to find clear indications of
the attack on the World Trade Center and the subsequent American attacks
on Afghanistan encoded nearby! In the picture, apart from the obvious "bloody battle
in Affghanistan" and "swift destruction", we can see
"World", "Trade" and "Center". To make
this clear, "twin" crosses "building" which is overlaid
by "WTC". "It's NYC" is nearby. In addition, alleged
key figure "Osama", Taliban leader "Omar", Osama's
military chief "Atef" and alleged chief hijacker "Atta"
are named. Also predicted is a "siege" and "ground war"
involving "NATO" and covered by "CNN". In a brief review of Bible Codes II, posted on Amazon before the book
was available in Australia, McKay wrote: I am the author of the "Moby Dick" codes mentioned
by an earlier reviewer. To see that codes appear anywhere, we can use
Drosnin's own book. Go to the extract that appears on this site and
locate the words "Lower Manhattan" a few paragraphs down.
Starting at the R of "Lower", count forward 32 letters at
a time to find the hidden message "R.U. FOOLED?" encoded in
the text exactly the same way that Drosnin's hidden messages are encoded
in the Bible. Moreover, the chance that this message appears so close
to the start of the book is less than 1 in 200,000, so, according to
Drosnin's logic, it must be there by design and not by accident. In Bible Codes II Drosnin explains that Bible Codes indicate that the
world will come to an end in 2006. He writes: The more closely we looked at the warnings in the Bible
code, the clearer it became that the ultimate danger centered on 2006.
That is the year most clearly encoded with "Atomic Holocaust"
and "World War," and also with the "End of the Days." He also found a suggestion that if the world acts now they might be
able to prevent this. This led him to two goals and the account of his
attempt to achieve these goals is the main content of the book. His first goal was to meet personally with world leaders to warn them
of the coming Apocalypse. He attempted to arrange such a meeting with
Clinton, Bush, Barak, Sharon, and Arafat. He was able to meet with people
close to these leaders but Arafat was the only one who would speak to
him personally. His second major goal was to determine the key to the Bible code. Throughout
the book Drosnin reports his discoveries to Eliyahu Rips and asks for
his reaction. Recall that Rips is a well known mathematician who was
one of the authors of the American Scientist article who claimed to
have verified that Bible Codes could not be due to chancel. Rips comments
are usually limited to stating the probability that Drosnin's latest
finding could have happened by chance. But when Drosnin asks him if
we will ever know the full Bible Code, Rips replies: "This will
only happen if we find the key to these codes." So Drosnin sets out to find this key. He need only search on key and
Bible Codes and finds that the key is engraved on stone pillars which
were enclosed in an "ark of steel"( brought to our world by
aliens) that ended up in the Dead Sea. Drosnin reports that he had been
given a written permit for archaeological expeditions to attempt to
find the the code key, but unfortunately this permission was withdrawn
with no explanation. So, alas, Drosnin did not achieve either of his two goals. In support of his alien theory, Drosnin reports that Francis Crick,
who with James Watson discovered the structure of DNA, believes that
DNA also was brought to our world by aliens. Crick did discuss this idea in his book "Life Itself" published
by Simon and Shuster in 1962. However, we found reading this book, after
reading Drosnin's, was a breath of fresh air. Crick writes about DNA which is generally agreed to exist and to be
the code of life. He observes that it is not too much of a stretch to
imagine that bacteria could one day be carried on a space ship from
earth to some other planet where the conditions for life were favorable.
Thus we might one day be responsible for establishing life on another
planet. But if this is possible for us it also might have happened the
other way around--an advanced form of life might have been established
on another planet before on ours and then transplanted to earth by a
space ship. He remarks that his wife regarded this as Science Fiction,
but he at least felt that it made some sense scientifically. Since there is no scientific evidence for the existence of Bible Codes,
Drosnin's suggestion that the Bible Codes key came on the same trip
is not very convincing. DISCUSSION QUESTIONS: (1) The New York Times listed the original Bible Codes book in the
non-fiction category of its best seller list. Do you think that was
appropriate? If so, and if Bible Codes II also becomes a best-seller,
should it also be listed under non-fiction? (2) If you did a survey, what proportion of the people in the U.S.
would you expect to believe in Bible Codes? Copyright (c) 2003 Laurie Snell This work is freely redistributable under the terms
of the \GNU General Public License published by the Free Software Foundation.
This work comes with ABSOLUTELY NO WARRANTY.
CHANCE News 11.05
11 October 2002 to 31 December 2002
