Prepared by J. Laurie Snell, Bill Peterson, Jeanne Albert, and Charles Grinstead, with help from Fuxing Hou and Joan Snell.
We are now using a listserv to send out Chance News. You can sign on or off or change your address at this Chance listserv. This listserv is used only for mailing and not for comments on Chance News. We do appreciate comments and suggestions for new articles. Please send these to:
jlsnell@dartmouth.edu
The current and previous issues of Chance News and other materials for teaching a Chance course are available from the Chance web site.
Chance News is distributed under the GNU General Public License (so-called
'copyleft'). See the end of the newsletter for details.
Unfortunately, the people making these arguments are statisticians. I'm not trying to say that statistics are not important,we can argue about how many angels can dance on the head of a pin. But these are real live patients, and it doesn't help anyone to go through this.
Dr. Maurie Markman
Director of the Cleveland Clinic Taussig Cancer Center
How often have I said to you that when you have eliminated the impossible whatever remains, however improbable, must be the truth?
Sherlock Holmes
Contents of Chance News 11.01
1. Forsooth.
2. The Royal Statistical Society and statistics in the courts.
3. An interesting web site.
4. Mammogram studies leave future unclear.
5. More on mammogram studies.
6. Cheeky little test exposes wine "experts" as weak
and flat.
7. Arnold Barnett: The Sept. 11 catastrophe raises many troubling
questions.
8. Does the euro coin come up heads too often?
9. Judge finds that fingerprints do not meet scientific standards.
10. Murderous pardons.
11. Sherlock Holmes tackles paradoxes in probability and statistics.
12. A letter to the editor for the New York Times.
Here are some Forsooth items from the December 2001 through February 2002 issues of RSS News.
From what you have seen or heard, who do you think did best in the live head-to-head debate on BBC2's Newsnight on Wednesday night?
| Kenneth Clarke |
16%
|
| Ian Duncan Smith |
29%
|
| Both did equally well |
17%
|
| Neither |
7%
|
| Refused |
1%
|
| Don't know |
30%
|
Sunday Telegraph
26 August 2001
(Interesting to compare 'equal' with 'neither'?)
Researchers at Cambridge University have found that supplementing with vitamin C may help reduce the risk of death by as much as 50%.
Higher Nature
Health News no. HN601, 2001
Candidate to be top scorer
in Euro-2000:
Vieri (Italy)
| Matches: |
17
|
| Goals: |
10
|
| Mean (goals per match): |
.17
|
Spectator
30 June 2001
In the December RSS there is an interesting public statement about the misuse of statistics in the courts and the need for qualified statisticians to present statistical evidence. This was the result of a widely publicized case involving a young women Sally Clark who was given two life sentences for murdering her first two babies, a few weeks after their births. She was convicted after an influential "expert" estimated the the frequency of the sudden death syndrome in families having some of the characteristics of the Clark family was one in 8500. Squaring this figure he obtained the estimate of 1 in 73 million for the frequency of two such deaths in a family. The press reported this as a 'one chance in 73 million' of the babies, born a year apart, both dying of natural causes.
To express their concern about the misuse of statistics in this case the Royal Statistical Society sent a letter to the Lord Chancellor regarding the use of statistical evidence in court cases. Knowing the care that goes into such a public statement it seems best just to give you the letter itself rather than trying to summarize it.
23 January 2002
Dear Lord Chancellor,
I am writing to you on behalf of the Royal Statistical Society to express the Society's concern about some aspects of the presentation of statistical evidence in criminal trials.
You will be aware of the considerable public attention aroused by the recent conviction, confirmed on appeal, of Sally Clark for the murder of her two infants. One focus of the public attention was the statistical evidence given by a medical expert witness, who drew on a published study to obtain an estimate of the frequency of sudden infant death syndrome (SIDS, or "cot death") in families having some of the characteristics of the defendant's family. The witness went on to square this estimate to obtain a value of 1 in 73 million for the frequency of two cases of SIDS in such a family. This figure had an immediate and dramatic impact on all media reports of the trial, and it is difficult to believe that it did not also influence jurors.
The calculation leading to 1 in 73 million is invalid. It would only be valid if SIDS cases arose independently within families, an assumption that would need to be justified empirically. Not only was no such empirical justification provided in the case, but there are very strong reasons for supposing that the assumption is false. There may well be unknown genetic or environmental factors that predispose families to SIDS, so that a second case within the family becomes much more likely than would be a case in another, apparently similar, family.
A separate concern is that the characteristics used to classify the Clark family were chosen on the basis of the same data as was used to evaluate the frequency for that classification. This double use of data is well recognize by statisticians as perilous, since it can lead to subtle yet important biases.
For these reasons, the 1 in 73 million figure cannot be regarded as statistically valid. The Court of Appeal recognized flaws in its calculation, but seemed to accept it as establishing "... a very broad point, namely the rarity of double SIDS" [AC judgment, para 138]. However, not only is the error in the 1 in 73 million figure likely to be very large, it is almost certainly in one particular direction - against the defendant. Moreover, following from the 1 in 73 million figure at the original trial, the expert used a figure of about 700,000 UK births per year to conclude that "... by chance that happening will occur every 100 years". This conclusion is fallacious, not only because of the invalidity of the 1 in 73 million figure, but also because the 1 in 73 million figure relates only to families having some characteristics matching that of the defendant. This error seems not to have been recognised by the Appeal Court, who cited it without critical comment [AC judgment para 115]. Leaving aside the matter of validity, figures such as the 1 in 73 million are very easily misinterpreted. Some press reports at the time stated that this was the chance that the deaths of Sally Clark's two children were accidental. This (mis-)interpretation is a serious error of logic known as the Prosecutor's Fallacy (1). The jury needs to weigh up two competing explanations for the babies' deaths: SIDS or murder. The fact that two deaths by SIDS is quite unlikely is, taken alone, of little value. Two deaths by murder may well be even more unlikely. What matters is the relative likelihood of the deaths under each explanation, not just how unlikely they are under one explanation.
The Prosecutor's Fallacy has been well recognised in the context of DNA profile evidence. Its commission at trial has led to successful appeals (R v. Deen, 1993; R v. Doheny/Adams 1996). In the latter judgment, the Court of Appeal put in place guidelines for the presentation of DNA evidence. However, we are concerned that the seriousness of the problem more generally has not been sufficiently recognised. In particular, we are concerned that the Appeal Court did not consider it necessary to examine the expert statistical evidence, but were content with written submissions.
The case of R v. Sally Clark is one example of a medical expert witness making a serious statistical error. Although the Court of Appeal judgment implied a view that the error was unlikely to have had a profound effect on the outcome of the case, it would be better that the error had not occurred at all. Although many scientists have some familiarity with statistical methods, statistics remains a specialised area. The Society urges you to take steps to ensure that statistical evidence is presented only by appropriately qualified statistical experts, as would be the case for any other form of expert evidence.
Without suggesting that there are simple or uniform answers,
the Society would be pleased to be involved in further discussions on the use
and presentation of statistical evidence in courts, and to give advice on the
validation of the expertise of witnesses.
Yours sincerely
Professor Peter Green,
President, Royal Statistical Society.
Cc: David McIntosh, President, Law Society.
--------------------------------------------------------------------------------
(1) Balding DJ & Donnelly P, Criminal Law Review, October
1994
This site, maintained by Paul Cox, reviews statistical applications in the news media. For example, a December article from the Arizona Republic reported that, for the war on terrorism, smaller states were apparently sending a greater share of their reserves than larger states. Cox proposes a possible explanation that the article overlooked: smaller states are likely to have a larger percentage of "specialty reserves," who are the most likely to be called up for the current effort. You can also find Cox's Glossary of Mathematical Mistakes
Cox provides definitions of mistakes commonly made in the media, coining such colorful terms as "Astrology Amnesia", "Factorectomy" and "Shooting the Barn Statistics."
The January 2002 issue of The College Mathematics Journal has a regular column "Media Highlights" edited by Warren Page with the help of several others including one of our own favorite contributors Norton Starr. In the January 2002 Peter Ross gave a nice description of the Chance web site. We have previously mentioned this column (Chance News 9.01 Item 3) and pointed out that, while it covers mathematics generally, it often has interesting probability and statistical articles that we have missed.
Years of debate have failed to produce consensus on the value of mammograms--especially for women under 50. Most recently, the data on which current screening policies are based were criticized in a letter published in the British medical journal "The Lancet" (Olsen, O. and Gøtzsche, P. (2001). "Cochrane review on screening for breast cancer with mammography," Lancet, 358, 1340-1342.) The letter concluded that there is no reliable evidence that mammography reduces breast cancer mortality.
The letter reported the results of a review of seven major studies on mammography. In the authors' judgment, five of these--all showing mammograms to be beneficial--were not reliable. They found two studies that they thought were reasonably carried but but which did not show much benefit for mammogram screening. The Globe article describes the kinds of problems that were identified. Some of the studies were not properly blinded; the doctors who assigned cause of death may have known which subjects were in the screening group. Elsewhere, there were concerns that pre-existing cancers may have been handled differently for women in the screening and control groups.
A pannel, called the PDQ screening and prevention editorial board, is an independent
group of specialists convened by the National Cancer Institute. Its job is to
sort out complicated data and put it up on the institute's Web
site . PDQ panel concurred, that there is insufficient evidence to prove
that mammograms prevent deaths from breast cancer, according to Donald A. Berry,
a panel member and chairman of the biostatistics department at M.D. Anderson
Cancer Center in Houston.
The NCI will maintain its current recommendations. In particular, they continue to believe that women in their 40s should have mammograms every one to two years. While acknowledging the need for careful review of existing data, the NCI emphasizes the need for further research on early detection of breast cancer, noting that several studies are now underway. You can find more details of their response here.
The Globe article echoes the concern that we need to move ahead, noting that the Lancet study seems to be focusing on the same data that have already been debated for many years. Fran Visco of the Washington-based National Breast Cancer Coalition is quoted as saying:
The evidence behind screening mammography is poor, certainly for women under 50. For too long, we feel, mammography has taken up too much space in the world of breast cancer.
A statement recently released by the coalition notes that:
In any age group, mortality reduction associated with mammography is less than 50 percent. Although it may be difficult to accept, it is vital that women know the truth.
DISCUSSION QUESTIONS:
1. What does the National Breast Cancer Coalition mean by a "false a sense of security"?
2. Do you think the popular media make clear the distinction between saying
that "screening reduces breast cancer mortality" and saying that "screening
prevents breast cancer"?
The Lancet article discussed above was a summary of work that Olsen and Gøtzsche reported in an article "Screening mammography re-evaluated" Lancet 2000; 355:752. The authors updated this work and wrote a more complete review for the "The Cochrane Library". The2001 Lancet article is a summary of this review. The Cochrane reviews are refereed by a review board that works with the authors to provide the final review. The Cochrane Library has centers throughout the world that work on these reviews. Gøtzsche and Olsen are directors of the Nordic Cochrane Center.
The aspects of the studies that they paid the most attention to are described in their 2000 article reporting on the information they requested of the investigators.
When necessary, we asked the investigators for details about the randomization method, in particular whether the assignment process was concealed so that no-one could foresee which assignment the next cluster or women would get before actual recruitment. We also asked for baseline characteristics that could show whether the screening group was similar to the control group in terms of important prognostic factors such as age, symptoms at entry, family history of breast cancer, socioeconomic status, and previous examinations for breast cancer. We noted whether all randomized women had been accounted for in the results and whether the cause of death had been assessed by a panel unaware of screening status. We also sought data on the morbidity associated with screening, defined as reported events that had occurred in at least 100 women.
In the Cochrane report, the authors classified the quality of the available data into four groups: high, medium, poor, and flawed. They concluded that none of the seven trials data were of high quality, two were of medium quality, two were of poor quality and two were flawed. The two of medium quality were the two that found no significant effect of screening on reducing breast cancer mortality and the five that were of lesser quality were the ones that found that screening did reduce breast cancer mortality.
James Press and Judith Tanur have recently written a book "The subjectivity of Scientists and the Bayesian Approach that we will review in the next Chance News. In their introduction they say:
The reader will see that the oft-expressed notion that science is "objective" is only partially true; in fact science is really a combination of both subjective and objective views.
In a recent lecture, Press used this mammography study as an example of the
need to recognize the role subjectivity in science. He mentioned for example
recent remarks by David Freedman in an article by Gina Kolata ("Study Sets
Off Debate Over Mammograms' Value" New York Times, 9 Dec. 2001) about the
Olsen Gotzsche review: After stating that Dr. Peter Greenwald, the Nation Health
Institute's director for cancer prevention was reserving judgment but felt that
it was an important study, Gina Kolata writes:
But other experts, like Dr. David Freedman, a statistician at the University of California at Berkeley, dismiss it as deeply flawed. Dr. Freedman said some of the studies Dr. Gøtzsche and Mr. Olsen cite as weak were actually the strongest, and vice versa. He called Dr. Gøtzsche" incredibly alert to all difficulties in work he doesn't like" but added, "In papers he does like, he swallows anything." Dr. Freedman said it would be ridiculous to demand evidence that mammography lowers the overall death rate. The reason, he said, is that breast cancer accounts for only 1 to 3 percent of deaths among women, making it impossible to see such an effect even if lives are saved. Mammography is not like aspirin and headache," he said. "The evidence is complicated. But the advice I would give someone is to get screened."
In a letter to the editor (Lancet, Vol 358, December 22/29, 2001) Jae Hong
Lee and Diana Zuckerman write
Meta-analysis requires many subjective decisions on the selection and weighting of variables. Each decision can introduce bias, no mater how systematic the decision-making process. A second set of investigators carefully analyzing the same data might reach very different conclusions. For example, many investigators did not agree with Olsen and Gøtzsche's decision to deem certain clinical trials unreliable on the basis of small baseline differences in mean age between screening and control groups.
Even the decision of what to look at in a study involves subjective decisions.
The authors of the studies reviewed tested for a reduction in breast cancer
mortality. In their article Olsen and Gøtzsche state that "The only
reliable mortality estimates are those for overall mortality."
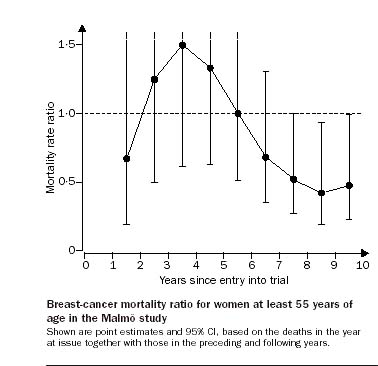
Still another point of view on what should be looked at was described in a recent
letter to Lancet, "Mammographic screening: no reliable supporting evidence?",
Miettinen et.al. Feb. 2, 2002, The writers observe that the authors of the Malmö
study, one of the two accepted as valid by Olsen and Gøtzsche, refer
to substantial reduction in breast-cancer mortality after a 6-year delay. They
say that such a delay in mortality gain is to be expected since the reduced
case-fatality rate, presumed to be a consequence of screening, tends to result
in fewer deaths from the cancer only after a suitable delay. Olsen and Gøtzsche
refer only to the overall result of this study: 63 deaths in the screening group
vs 66 in the control group which is not a significant improvement. The authors
of this letter present the following graph based on the data in the Malmö
study.
Note that there is a substantial decrease in the mortality ratio after 6 years but, alas, there also seems to be a significant increase in the years before this. The authors note this but offer no explanation. This is an interesting example of one outcome being almost significant and another being just barely significant.
The authors of this letter also state that screening in the Canadian study, the other study that Olsen and Gøtzsche accepted as valid, continued for only 3-4 years after study entry, and follow-up stopped at the point at which follow-up in the Malmö study started to show fewer breast-cancer deaths among those screened.
Where does all this leave us? Olsen and Gøtzsche feel that an effect on overall mortality needs to be shown in a high-quality randomized trial. They estimate that such a trial would require 1.2 million women in each arm of the trial. Others have recommended an even more thorough analysis of the data from existing studies. Neither seems very hopeful in the immediate future. Thus the situation remains, as one expert described it, "a mess".
DISCUSSION QUESTIONS:
(1) If you read the Olsen and Gøtzsche review you will see that even the facts about how the studies reviewed were carried out were difficult to determine. Simple facts about how the randomized was carried out, how many outcomes were x, etc. differ in the various publications and theses based on the study. Do you find this surprising>
(2) In evaluating the value of breast cancer screening Olsen and Gøtzsche feel that it is important to include the fact that false positive tests can lead women to have procedures that are not necessary and possibly harmful to say nothing of considerable stress. It is estimated that a person having annual mammogram tests yearly for ten years has a 50% chance of having a false positive test. Others say that this should be cured by better medical advice and we should not blame the tests. Do you agree?
(3) Do you think that statistics should be able to do better on an issue like this?
In highbrow versions of a CHANCE favorite--the "Coke-Pepsi Challenge"-- 57 top wine experts were asked to rate several different bottles of red wine. [The studies are described (in French) at here.] They had no trouble distinguishing subtle differences in flavor, using attributes such as "floral", "dusty", "austere", "zesty", and "jammy". However, what none of the experts noted was that one of the wines was in fact a white wine that had been tinted red. In another deception, experts sampled an "average" Bordeaux wine--once from a bottle bearing a high-prestige, "grand cru" label, and again from a bottle with an ordinary "vin de table" label. Their ratings were nearly opposite: "agreeable, woody, complex, balanced, rounded" for the former, but "weak, short, light, flat, faulty, and with a sting" for the latter. Forty experts said the fancy-labeled wine was good, while only twelve said the same for the plain-labeled wine.
The author of the study, Frederic Brochet, has also studied the brain activity of wine tasters. This research shows that flavor and smell are processed in the brain very close to where colors and prior knowledge are processed, so that what we perceive when sampling wine is likely a mixture of taste, visual stimuli, and thought. Since the brain receives visual information faster than smell and taste, perhaps the experts can't entirely be faulted for their performance.
We contacted Orley Ashenfelter, an economist at Princeton and also a wine expert, for his comments about Brochet's study, and he directed us to related work at the site "Liquid Assets: The International Guide to Fine Wines", which he writes and publishes. On it are several articles that discuss statistical methods and questions that arise in the analysis of wine tastings (scroll to the bottom of the site.)
One paper, "Measurement and Inference in Wine Tasting " (by Richard Quandt) compares ranking and grade-scale systems for evaluating and comparing a collection of wines. One goal is to develop appropriate measures of what it means for a wine to be "significantly" good or bad. The paper also discusses two versions of the "matching problem" for wines, both of which resemble Brochet's study in some respects:
(1) if a person tastes n wines, and is given a list of n wines, what is the expected number of correct identifications?
(2) If a person tastes n wines, and knows that N1 are of type X and N2 are of type Y, what is the distribution for the number correctly identified by type?
Another interesting article on wine testing, "Parker v. Prial: The Death of the Vintage Chart," (by Roman L. Weil), " appeared in Chance Magazine Vol 15, No. 1. This article describes an experiment to determine the degree to which "enthusiastic amateurs" can (a) distinguish, in blind tastings, highly rated from poorly rated wines, and if so, (b) will correctly identify which is which. (The title refers to wine guru Robert Parker, author of many influential wine guides, and Frank Prial, author of several books on wine and the "Wine Talk" column of The New York Times.)
Weil concludes that
(a) tasters can, significantly better than guessing, distinguish the two types
of wine, but
(b) those that could distinguish the wines picked the highly rated wine only
50% of the time.
Thus he advises: "lighten your wallet" and get rid of the vintage chart!
The papers are very clearly written and provide an unusual and fun illustration of many elementary ideas.
DISCUSSION QUESTIONS:
(1) How would you answer the questions (1) and (2), above, posed in Quandt's
article?
(2) In developing the distribution for the wine matching problem, Quandt remarks
that it is, "remarkable that the distribution converges very rapidly in
n to a limiting form."
What is this limit?
Arnold Barnett is a widely recognized expert on air traffic safety. In this essay he brings his unique perspective to some of the questions that have arisen since September 11.
Immediately after the attacks, most observers described the events as unforeseeable. Barnett cites a number of prior incidents which, while apparently unrelated, suggest that pieces of the puzzle were available if officials had thought to put them together. For example, perpetrators of a failed Air France hijacking in 1994 had intended to crash the plane into the Eiffel Tower. In other parts of the world, suicidal hijackers had shown willingness to inflict mass casualties.
Barnett uses the phrase "pervasive thoughtlessness" to describe the state of security operations prior to the attacks and says that officials acted as if they did not believe domestic flights could be targeted. Beyond the widely publicized lack of training of security personnel, Barnett describes some lapses in strategic thinking. In 1998, airlines began using a computer model called CAPPS to screen for potential terrorists. The model flags about 5% of passengers as suspicious (so-called "selectees"), and the policy was that unless these passengers boarded the plane, their luggage would not be carried. Clearly, such a procedure would not avert a suicide bombing. Prior to the introduction of CAPPS, screening was less sophisticated, but suspects were subjected to more careful scrutiny, including personal interviews and searches of their pockets, carry-on bags and checked luggage.
Barnett worries that the developers of CAPPS may have derived a false sense of security from the sheer complexity of their formula, since it was unlikely that a terrorist would be able to deduce its form. While that may be true, he points out that "Someone wishing to 'beat' CAPPS did not need to know the formula: All he needed to know was whether a specific combination of characteristics (e.g., type of ticket, form of payment, passenger's age and travel history) would avoid the designation of selectee. In mathematical terms, one did not need to know the exact equation of the yes/no threshold, but simply whether a particular point was to the left of the curve."
Barnett analyzes two proposals to increase security on US domestic flights: eliminating advance seat selection and requiring 100% positive matching of bags to passengers. The first aims to prevent conspirators from planting weapons that could be used on a later flight. Barnett worries about the large impact this would have on travelers, and concludes that careful inspection of seats between flights would be a more effective solution. As for the second proposal, Barnett is bewildered by the airlines' steadfast resistance to bag-matching on domestic flights, since its feasibility has already been demonstrated in Europe. He also cites a 1997 research experiment that he conducted with several colleagues. They concluded that 100% matching on domestic flights would cause an average delay of seven minutes for one flight in seven, which hardly seems prohibitive. While matching is not a perfect solution, Barnett notes that we are still years away from having the capability to screen all bags for explosives. He sees little reason not to implement matching now.
Finally, Barnett turns to the questions of when and if people will return to air travel. He observes that September 11 makes estimating the current death risk from flying problematic, since more planeloads of passengers died on that day than in the entire decade leading up to it: "If crashes are weighed by the proportion of passengers killed, then U.S. domestic jets suffered 4.00 'full' jet crashes on Sept. 11 and 3.39 in the previous decade."
DISCUSSION QUESTIONS:
(1) Do you understand Barnett's comment about the CAPPS formula? How would a terrorist deduce "whether a particular point was to the left of the curve"?
(2). The finding by Barnett's team that one flight in seven would incur a delay averaging seven minutes is summarized in the article by saying that matching "would cause departure delays averaging one minute." Do you understand the calculation? How would you explain this to your Uncle Harry, who just got off his flight complaining that he sat on the runway for 10 minutes while bags were matched--ten times what he was promised.
(3) Do you understand what it means to weight crashes by the proportion of passengers killed?
Are the new euro coins fair? To answer this question for the Belgian euro, students in a statistics class spun the coin on a table 250 times and got 140 heads (specifically, King Albert's). The authors also conducted "an unscientific but mind-numbingly thorough test" using the German euro ( (the diameter and weight of all one-euro coins are the same, but each country has its own symbol on one side). Out of 100 spins, 54 came up heads; among 100 tosses, 60 were heads.
A standard activity for statistics classes is to spin US pennies and observe that they come up less often heads than tails. In his book "A Mathematician Reads the Newspaper" Paulos states that spinning coins results in only about 30 percent heads. Another activity is to stand a dozen or so pennies on edge on a table and then bang the table so all the pennies fall down. This will often result in 90% or more heads. Apparently this is also true for nickels which are easier to stand on end. It is interesting that, with all these activities, we were not able to find any data set large enough to convincingly support these claims. Perhaps one of our readers will be able to provide such a data set. Bob Hayden has found variation between coins which makes this an even more interesting statistical problem.
Tossing a US coin appears to come up heads about half the time, providing a better tool for deciding who should kick off in a football game and other such important decisions. However, even here, we were not able to find recent data. There have been interesting historical accounts of this experiment. The French naturalist Count Buffon (1707-1788), know to us from the Buffon needle problem, tossed a coin 4040 times with heads coming up 2048 or 50.693 percent of the time. Karl Pearson tossed a coin 24,000 times with head coming up 12,012 or 50.05 percent of the time. While imprisoned by the Germans in the second world war, South African mathematician John Kerrich tossed a coin 10,000 times with heads coming up 5067 or 50.67 percent of the time. You can find his data in "Statistics" by Freedman, Pisani and Purvis.
DISCUSSION QUESTIONS:
(1) Are the results of the euro-one coin tossing significant?
(2) One explanation given for spinning coins favoring heads or tails has been
that one side is heavier than another. Another is that the edge is slanted so
that the coin is not a true cylinder. How would you test these theories?
(3) The article begins, "Heads or tails? The new one-euro piece may not
be trusted to be quite fair." What do you think?
(4) In attempting to explain the difference between spinning and tossing coins, the authors only say, "In theory, tossed coins should not favor one side--even if asymmetric--as there are more variables." Do you think this is a sufficient explanation?
(5) How many tosses (or spins) do you think is sufficient to determine if a coin is fair?
We've all seen television courtroom dramas where the fingerprint expert states that the defendant's fingerprints definitely match prints found at the crime scene. But how reliable is such testimony?
Not reliable enough, according to a recent ruling by federal judge Louis Pollak of Philadelphia, who found that the procedure does not meet the standards for scientific evidence set by the Supreme Court in early 1990s. The Court said that expert witnesses cannot give opinions based on a scientific technique unless that technique has been tested and has a known error rate. Critics of fingerprint evidence have argued that it has never been subjected to such testing, while fingerprint experts have maintained the unrealistic position that the error rate is in fact zero. Under Judge Pollak's new ruling, fingerprint experts can discuss "points of similarity" between a defendant's prints and those found at a crime scene, but can not declare that a match has been found.
Although Judge Pollak's ruling has immediate force only in his court, it is sure to encourage further challenges to fingerprint evidence. (We reported on one such challenge in Chance News 10.01.) Furthermore, prosecutors worry that if Pollak's view gains wider acceptance, then techniques such as hair analysis, handwriting analysis and ballistics matching will eventually face similar scrutiny.
The Economist article concludes with the statement that "even the 'gold standard' of evidence, DNA testing, may face challenges. However, matches with DNA are already expressed as statistical probabilities rather than as certainties. Thus it is the admitted error of DNA testing, rather than its claims to infallibility, that will safeguard its continued used in the courts."
DISCUSSION QUESTION:
If fingerprinting were scientifically assessed, do you think it could match the impressive probability thresholds achieved by DNA testing? If not, do you think this should doom fingerprint testimony?
There is a long-running debate about the deterrent effects of the death penalty. The latest installment comes from economists H. Naci Mocan, and R. Kaj Gittlins who have just published their finding that governors' pardoning condemned murderers leads to an increase in the number murders. Mocan is a research associate at the National Bureau of Economic Research.
Mocan and Gittlins studied Justice Department data on all 6143 death sentences in the US from 1977 to 1997. Their statistical analysis controlled for state to state variations in such factors as income, unemployment, age and racial compositions, and proportion of urban population. As presented in the article, the authors' overall conclusion is that "each execution decreases [the number of homicides] by five to six, while three additional pardons generate one to 1.5 additional homicides beyond the number of murders that would have been expected to occur in the state during the following year."
Mocan explains their results in terms of basic economic principles. A pardon reduces the chance that a murder conviction will result in a death penalty, thus effectively decreasing "the cost of committing a crime." The costs are in some sense publicized by the media. Mocan is quoted as saying that "executions make headlines, and pardons make headlines as well. The question is whether the headlines in the media and other, informal channels are powerful enough to affect behavior. The answer is evidently yes... ."
The article is careful to point out that the authors are not necessarily advocating the death penalty. Their paper acknowledges his concerns about the racial biases that have been demonstrated in its application.
DISCUSSION QUESTIONS:
(1) Do the authors' findings mean that pardons cause murders? Can you think of any other explanation?
(2) Do you think all pardons and all executions draw equivalent publicity? What are the implications for the explanation given above?
Our next article was suggested by John Vokey and might raise questions about the previous article.
You can request a longer and more technical version of this article from the author (goertzel@camden.rutgers.edu)
The author explains his thesis for this article as follows:
Do you believe that every time a prisoner is executed in the
United States, eight future murders are deterred? Do you believe that a 1% increase
in the number of citizens licensed to carry concealed weapons causes a 3.3%
decrease in the state's murder rate? Do you believe that 10 to 20% of
the decline in crime in the 1990s was caused by an increase in abortions in
the 1970s? Or that the murder rate would have increased by 250% since 1974 if
the United States had not built so many new prisons?
If you were misled by any of these studies, you may have fallen for a pernicious form of junk science: the use of mathematical models with no demonstrated predictive capability to draw policy conclusions. These studies are superficially impressive. Written by reputable social scientists from prestigious institutions, they often appear in peer reviewed scientific journals. Filled with complex statistical calculations, they give precise numerical "facts" that can be used as debaters’ points in policy arguments. But these "facts" are will o' the wisps. Before the ink is dry on one study, another appears with completely different "facts." Despite their scientific appearance, these models do not meet the fundamental criterion for a useful mathematical model: the ability to make predictions that are better than random chance.
The author then gives four studies of murder rates where regression is used to make causal arguments which he calls "myths of multiple regression". These are:
Myth one: More guns less crime.
Myth two: Imprisoning more people cuts crime.
Myth three: Executing people cuts crime.
Myth four: Legalized abortion caused the crime drop in the 1990's.
Readers of Chance News will be familiar with the author's case study for Myth
1. This is the work of Yale economist John Lott which was presented in his popular
book More Guns, Less Crime discussed in Chance
News 7.07. Lott's analysis involved the "shall issue" laws that
require local authorities to issue a concealed weapons permit to any law-abiding
citizen who applies for one. Goerzel remarks that Lott estimated that each one
percent increase in gun ownership in a population causes a 3.3 percent decrease
in homicide rates. He says that Lott has more data and more complex models than
anyone else and that Lott argues that anyone who wants to challenge his conclusions
has to show what is wrong with his data and model.
In 1998 econometriciens, Dan Black and Daniel Nagin accepted the challenge and
showed that if they changed the statistical model a little bit or applied it
to different segments of the population Lott's findings disappeared. Lott collected
data for each of the 50,056 U.S. counties for each year from 1977 to 1992. As
it happens a large proportion of the of murders in the United States take place
in a few very large counties, none of which have "shall issue" laws.
When asked about this Lott replied that he had "controlled" for population
size in his model. Goerzel remarks:
Lott's whole argument came down to a claim that the largely rural and western "shall issue" states were spared the crack-related homicide epidemic because of their "shall issue"laws. This would never have been taken seriously if it had not been obscured by a maze of equations.
DISCUSSION QUESTIONS:
(1) The author quotes David Freedman as saying:
I do not think that regression can carry much of the burden in a causal argument. Nor do regression equations, by themselves, give much help in controlling for confounding variables". Do you agree with this? How could social scientists show that "shall issue" laws cause a decrease in murders?
(2) Do you think that mathematical models alone will be able to show that increases in "greenhouse gases" by humans will cause global warming?
This is a new book by Colin Bruce a physicist and science writer living in Oxford. He wrote the popular "The Einstein Paradox And Other Science Mysteries Solved by Sherlock Holmes" about which the New York Times Book Review wrote:
Readers are introduced to the bizarre concepts of modern physics as the only way to solve a casebook of otherwise impossibly paradoxical crimes. "What better way to explain to nonscientists the sometimes mystifying world of modern physics than by enlisting the aid of that master demystifier, Sherlock Holmes?"
The same remarks can be made about this book replacing "the sometimes mystifying world of modern physics" by "the sometimes mystifying world of probability, statistics and logic."
The solutions to Sherlock Holmes cases are based on apparent paradoxes such as Bible code and birthday coincidences, false positive tests, Benford's law, prisoner's dilemma, the gambler's paradox etc. We give the flavor of the book by showing you how Sherlock Holmes deals with the gambler's paradox in Chapter 2, "The Case of the Gambling Nobleman."
We find Watson and Holmes in their Baker street apartment on the evening of the last day of 1899. Holmes is in a philosophical mood.
Holmes: Just as we are wishing a happy Christmas, so we are wished a prosperous New Year. At year's end, many a man sits contemplating the paucity of his worldly achievements, and the magnitude of his debts, until the dawn brings not hope but despair.
Watkins: Well, I suppose that in general those who find themselves with so little have only their own idleness or folly to thank.
Homes: Once I might have said so, Watson. But the more I see of life, the more I am struck by how great a part is played not by brains, or skill, or character, but by simple chance. The success or failure of a business venture, or a marriage, or a war, can depend more on the blind roll of Fate's dice than on any planning. Life is a chaotic business, and the most unpredictable of happenings can determine the fate of one man's life or of a whole nation. The whim of Lady Luck rules all.
There is a knock on the door and a young women of "wholesome rather than beautiful appearance is invited to come in."
The visitor: Mr. Holmes they tell me you are the cleverest man in London. I have come to ask you if you will stoop to giving some advice to the man who may well be the most foolish!
Holmes: Let us hope that your opinion of your moneyed but unreliable fiancé is similarly exaggerated.
The lady hesitated. Holmes smiled at her.
Holmes: A young lady wearing an engagement ring, who comes to me concerned about a man, is likely to be speaking of her fiancé. And a man who buys his intended a diamond-studded ring has money. But if the ring has shortly to be pawned--I saw the broker's mark still on the metal--his dependability is perhaps less to be trusted.
We learn that her fiancé is the Marquis of Whitebridge and that he is trying to save the family estate. He studied classical philosophy at Cambridge and is convinced that he has a deeper insight into the laws of mathematics than modern students of the subject. He has become obsessed with the notion that he can formulate a gambling system that will enable him to increase his money more rapidly than conventional investments. His first idea is to play roulette and wait for a long uninterrupted sequence of one color--either red or black--and then place a modest bet on the opposite color. He bases his hope for success on the fact that, in the long run, the proportion of heads and tails is guaranteed to become ever closer to unity.
Watson: What folly,Holmes!
Holmes: You do not think his gambling system sound, then?
Watson: Obviously not. How could a roulette wheel possibly
remember
which color had come up previously and hence favor the opposite on the next
spin?
Holmes: Answer me this, Watson. You embark on a marathon
ten-thousand-spin test. After ten spins, you have recorded seven red and three
black. You know that the ratio will in due course return toward unity. But
how can that happen, unless some subtle mechanism is now encouraging the wheel
to turn up black slightly more often?
Watson: Why, I--I cannot imagine, Holmes! Obviously, to restore the numbers so that the black count more nearly equals the red, some corrective force must operate.
Holmes: That is quite true.
Watson: Then I can only suppose that there are indeed some as yet undiscovered subtleties in the laws of Nature. Perhaps in some holistic way, the universe retains a memory of previous events, to correct the balance of probability in due course?
Holmes: Nonsense, Watson. You did not listen properly.
I did not say that the numbers of red and black will become more nearly
equal. I said that the ratio of red to black would do so.
Watson: Well, if there is a difference, I am afraid it
escapes me.
Holmes: It is easily demonstrated with algebra, Watson--no, have no fear,
I will respect your allergy to mathematics. Now there is a coincidence if you
lie, Watson. Outside there, I see the ideal man to explain the point to you
and without using so much as one algebraic symbol!
Watson hurried to the window. The blizzard had evidently driven the earlier crowd indoors. A layer of snow covered the ground marred only by a zigzag line of footprints down the road. A very drunk sailor was slowly attempting to make his way northward. However, after every step he took forward, he could not help lurching sideways either to the left or to the right.
Watson: Really, Holmes, that sot is obviously incompetent
to explain anything to me.
Holmes: Not in words, Watson, I grant you. But his movements are most eloquent. A fine demonstration of the Drunkard's Walk.
Holmes grasped a sheet of paper from the table and drew the following sketch:
Read the book and find out how Holmes uses this picture to explain the gambler's paradox!
DISCUSSION QUESTIONS:
(1) What do you think Holmes had in mind when he answered Watson's remark "Obviously, to restore the numbers so that the black count more nearly equals the red, some corrective force must operate" by "That is true".
(2) The picture that Holmes sketched looks like a perspective drawing with the point of infinity being the intersection of the two lines. If this is the case what is wrong with the random walk?
(3) Could you explain the gamber's paradox using Homes sketch?
Gerry Hahn sent us the following letter that he sent to the New York Times:
Re. "Discovering what it takes to live to 100” (Science
Times, Dec. 25, 2001)
I read this article with much interest—especially since I have a 99 year
old mother (whose only sibling lived to be 93). However, I must take issue with
the statement under the picture that “about one in 10,000 Americans now
lives to 100”—a comment not repeated in the article. The statement
is vague since it does not make clear whether it refers, for example, to all
Americans currently alive, all Americans born in 2001, or all Americans born
in 1901. The article also says that “today, about 50,000 Americans are
100 or older.” My concern is this. Let’s make the conservative assumptions
that the statement refers to Americans born in 1901, and that one fifth of those
50,000 people alive today, or 10,000, are exactly 100 years old. This implies
that--if the chances of living to 100 are one in 10,000--the number of Americans
born in 1901 was about 10,000 times 10,000 or 100 million! My unverified “back
of the envelope” calculations suggest that, assuming the 50,000 number
is correct, the chances of surviving to age 100 is more like one in 250. I hope
this provides readers added hope.
Gerald J. Hahn
1404 Orlyn Drive
Schenectady, NY 12309
The writer, a Fellow of the American Statistical Association, recently retired after 48 years of statistical practice.
Editors comment: In case you wondered how many births there are in the US in a year, currently there are about 4 million a year and in the 1900's it was between 2 and 3 million. The current life tables estimates that of 100,000 people born today the expected number that will live to 100 or more is 1,761 (for women it is 2,594 and for men 757).
Often when we run out of steam preparing a Chance News we find we have left out an interesting topic. Starting with this issue we we at least tell you what these topics are so that you can pursue them yourself if they sound interesting to you. Here are two stories we would have included in this Chance News if we had not run out of steam
The January 21, 2002 issue of Sports Illustrated has an article entitled "That Old Black Magic" by Alexander Wolff. It concerns the whether the Sports Illustrated jinx (regression towards the mean for appearance on the magazine's cover) is for real. It is based upon six months of research in which virtually all of Sports Illustrated 2,456 covers were analyzed. Among those quoted in the article are Gary Smith from Pomona and Tim Gilovich from Cornell. There is additional information on the magazine's website.
We read the article and agree with John that readers of Chance News will enjoy it.
We have enjoyed Jordon Ellenberg's columns for Slate Magazine before. (See Chance 10.07 and Chance News 10.08). Here is another Ellenberg article that we think Chance News readers will enjoy and would have included here if we had not run out of steam.
Here is a paragraph from Jordon's article to wet your appetite.
When it comes to visualizing American politics, Poole and Rosenthal believe, we're a lot like the person navigating New Jersey with the massive spreadsheet but no map. Anyone can tell you that Barbara Boxer is politically closer to Dianne Feinstein than she is to Zell Miller. One could even quantify this "closeness" by computing the proportion of roll-call votes on which Barbara Boxer and Dianne Feinstein agreed. But can we use all this numerical information to produce a "map" of the U.S. Senate? Put another way, if we know the distance between each pair of cities, can we reproduce the map of New Jersey?
This work is freely redistributable
under the terms of the GNU
General Public License published
by the Free Software Foundation.
This work comes with ABSOLUTELY NO
WARRANTY.