!!!!!!!!!!!!!!!!!!!!!!!!!!!!!!!!!!!!!!!!!!!!!!!!!!!!!!!
CHANCE News 10.08
August 14 , 2001 to September 18, 2001
!!!!!!!!!!!!!!!!!!!!!!!!!!!!!!!!!!!!!!!!!!!!!!!!!!!!!!!
Prepared by J. Laurie Snell, Bill Peterson, Jeanne Albert, and Charles Grinstead, with help from Fuxing Hou and Joan Snell.
We are now using a listserv to send out Chance News. You can sign on or off or change your address at this Chance listserv. This listserv is used only for mailing and not for comments on Chance News. We do appreciate comments and suggestions for new articles. Please send these to:
The current and previous issues of Chance News and other materials for teaching a Chance course are available from the Chance web site.
Chance News is distributed under the GNU General Public License (so-called 'copyleft'). See the end of the newsletter for details.
The better prepared we (science writers) are, the better
the questions will be, the more solid our stories, and the
freer we may feel to write the most compelling yet valid
copy. There is nothing like knowing a story to make the
words fly.
Victor Cohn
Contents of Chance
News 10.08 1.
Are the current state run lotteries better than when the Mafia ran them? 2. Was the Powerball 294.7 million jackpot
a favorable game? 3. Scientists
say frenzy over shark attacks is unwarranted. 6.
New research fuels debate over genetic food altering. 7.
Medical editors draw a line in the sand. 8. How are the darts doing against the experts?
Big lotteries' real loser.
New York Times, 29 Aug. 2001, A22, editorial desk
The $294.7 million jackpot for the 25 August drawing caused another lottery mania.
This editorial states that the Powerball lottery sales this year are running 40% ahead of last year. According to the editorial the biggest players are disproportionately poor and uneducated. The editorial states:
The top 20 percent of players, who spend an average of more than $4
on tickets each day, account for more than 80 percent of all sales. They
are almost twice as likely as the average adult both to have dropped out
of high school and to have a household income under $10,000. Surveys
show that the higher the household income, the fewer dollars spent on
lottery tickets.
In 1997 the Powerball Lottery was changed to reduce the chance of winning a jackpot from 1 in 55 million to 1 in 80 million. Lottery organizers have learned that, by reducing the chance of winning a jackpot, more jackpots go unclaimed and occasionally accumulate to huge jackpots like the August 28th $294.7 million jackpot. When such a jackpot occurs the ticket sales ($204 million for this jackpot) is greater than several weeks of smaller jackpots.
New York is considering adding the Powerball lottery and other forms of gambling. The editorial states that, in New York State, as many as one in every 11 players is a compulsive gambler and concludes: The last thing they need is more places to bet, or bigger prizes to pursue hopelessly.
In letters to the editor (New York Times, 3 September, 2001, A14) relating to this inteview Jerry Holzman writes:
Long ago, all betting was handled by crime syndicates. It was
their major source of cash and power. The lottery was introduced
to eliminate this evil, and it has been successful. The lottery is very
much the lesser of the two evils.
However, James Thompson writes:
No so many years ago, it was illegal to gamble and the mob ran
its numbers games through a vast street-level retail network. They
paid out about 85 percent of the amounts that were bet, retaining
15 percent or less for profits and expenses like payoffs. Now the
state government is in the numbers racket, but it pays out less than
50 percent in prizes and subjects us to misleading advertising that
no private company would be allowed to run. (We assume he is
referring to the fact that the 4 winners for the $294.7 million
jackpot got only a total of 166 million because they chose the
cash option.)
We could not see how the mob could run such a favorable lottery so we did some research on the numbers game. We found a wonderful account of the history of this game in "Scarne's Complete Guide to Gambling" written in 1961 when lotteries were illegal in the US and and yet thel numbers game thrived.
In 1921 in Harlem a lottery was being run that sold "Treasury tickets" for 50 cents and a dollar. Each ticket had a five-digit number and you won a prize if at any time during the week the last five digits of the the US treasury balance agreed with their five-digit number. This treasury balance was published daily in the newspapers. Realizing that many people could not afford 50-cent tickets they included a 10-cent ticket. This sold so well that they abandoned the 50-cent and dollar tickets. But it cost just as much to print the 10-cent tickets as it had to print the 50-cent and dollar tickets and so the printing costs were eating up their profits. Thus they worked on ways to avoid printing tickets and were led to a daily lottery called "The Cleaning House Numbers". For this game, players chose three numbers and made bets from a penny to a quarter. The player wrote his selected number, the amount of his bet, and the date on a slip of paper. The winning numbers were the last three digits of the Cincinnati Clearing House daily balance. Players were paid off at 500 to 1. This daily lottery soon became popular for blacks and whites in the poorer sections of most of the major cities.
In 1932, when prohibition was repealed, the racketeers had nothing to do so they moved in with their machine guns and took over running the Clearing House lottery. This lottery became called the Numbers game and Scarne describes how the it run in terms of the following terminology that developed.
An "agent" was a person who solicits bets. These included storekeepers, newsstand operators, employees of business, hotels, etc. A "runner" picked up the daily bets from a number of agents and took them to a "Drop" where a "Controller" collected them. The controllers, in turn, took their daily receipts to a "Bank". The runners then took the payoffs to players who hit a number.
Under this new management the payoffs varied from 500 to 600 to 1. The inevitable happened when the clearing house was bribed to round off the numbers so the winning number would be known to be 000. This led to the banks obtaining the winning three digit number by using the last digits of the total amount bet on three different horse races also reported in newspapers.
Now we check the James Thompson's claim in his letter to the editor that the mob paid back 85%. Here is Scarne's description of what happens to a $1 bet:
Commissions to runners range from 10% to 25%. If your runner receives 25% he
turns over 75 cents of your dollar to the controller, who takes a 5% commission
and passes on 70 cents to the bank. If the bank pays off at 600 to 1, the winners
will get back 60 cents, as prize money. That leaves the bank with 10 cents.
Thus the bank does pay out 60/70 = .857 so Thompson's claim that the mob paid out 85% is technically correct but the buyers themselves got at most 60% of the money taken in.
The Powerball lottery gives out about 50% in prize money. The stores that sell the ticket get about 5% and the other operating expenses are about 15% of the sales. This leaves 30% to be used by the state for tax relief, school expenses etc. Thus the main differences are that the public gets some tax relief and the runners are out of work.
DISCUSSION QUESTIONS:
(1) In the runners game, a bank would often pay out less money for popular numbers. For example, instead of paying 600 to 1 for the number 711 they paid 400 to 1. In the baseball season you only got 400 to one if you chose Willie May's batting average, etc. Why do you think they did this?
(2) Scarne uses the following kind of calculation to show how bad an investment the numbers game was. Assume that the payoffs are 600 to 1. Make bets for a week (from Monday to Saturday) as follows. Start with $1000 dollars and on the first day bet $1 on all the 1000 possible three digit numbers. Continue this way, using only the amount you have after the previous day's bets, betting an equal amount on all the numbers. How much will you have at the end of the week?
Jordan tackles the problem of determining the expected value of a Powerball ticket for the August 25th jackpot of $294.7 million dollars. As in his two previous columns reviewed in the Chance News 10.7, Jordan actually carries out the math explaining the basic concepts such as expected value, binomial distribution, and Poisson approximation as he goes along.
We admire Ellenberg's bravery in including some real math in his stories. Another interesting example of this is his recent column Algebra for Adulterers that leads to the math of coincidences and concepts related to the "6 degrees of seperation" phenomena.
In the Powerball lottery buyers choose 5 distinct numbers from 1 to 45 to try to match five white balls drawn from a drum with balls numbered from 1 to 45 and an additional number from 1 to 42 to try to match the ball drawn from a drum with red balls numbered from 1 to 42.
The total number of possible
choices for the numbers you pick is the number of ways to choose 5 distinct
numbers from 45 for the white balls and one additional number from 1 to 42 for
the Powerball . The number of ways that this can be done is C(5,42)*42 = 80,089,128
where C(5,42) is the number of ways to choose 5 elements from a set of 42. Thus
the probability of winning the jackpot is 1/80,089,128 = 0.0000000125. Here
is a list of all the possible prizes and the probabilities of winning them.
|
You
match
|
Win
|
Number
of ways |
Probability
of winning
|
|
5
white balls and the red ball
|
JACKPOT
|
1
|
.0000000124861
|
|
5
white balls and not the red ball
|
$100,000
|
41
|
.00000051193
|
|
4
white balls and the red ball
|
$5,000
|
C(5,4)*C(44,1)
|
.00000274694
|
|
4
white balls and not the red ball
|
$100
|
C(5,4)*C(44,1)*41
|
.000112625
|
|
3
white balls and the red ball
|
$100
|
C(5,3)*C(44,2)
|
.000118118
|
|
3
white balls and not the red ball
|
$7
|
C(5,3)*C(44,2)*41
|
.00484285
|
|
2
white balls and the red ball
|
$7
|
C(5,2)*C(44,3)
|
.00165366
|
|
1
white ball and the red ball
|
$4
|
C(5,1)*C(44,4)
|
.00847500
|
|
0
white balls and the red ball
|
$3
|
C(44,5)
|
|
|
0
white balls and the red ball
|
$3
|
C(44,5)
|
.01356 |
If we could assume that we would get the $284.7 million jackpot if we choose the winning numbers, we could calculate our expected winning by multiplying the value of each winning by its probability and adding them up. We would find that our expected winning is 3.67 -- quite a favorable bet.
But as Jordan remarks,
this is not reality. For all prizes except the jackpot we really collect the
amount of the prize. But if we choose the winning numbers we are not assured
of getting $284.7 million. First of all we have to take into account that we
might have to share the jackpot if more than one winner has the winning numbers.
For large jackpots a large number of tickets are sold (204 million for this
jackpot) making this a distinct possibility.
In fact, there were 4 winners for the August 28th lottery.
Secondly, even if you are the only winner, you have to make a choice between taking the full $294.7 million as an annuity with equal payments spread over a 25 year period or a cash value of $166 million. In this lottery there were four winners all of whom took the cash payment of 41.5 million.
Taking all this into consideration, Jordan calculates the expected value of a $1 ticket when the jackpot is $294.7 million. Here is how he did it. First, using our table, we calculate the expected winning from the prizes excluding the jackpot. The result is an expected winning of 20.8 cents from these prizes.
Next we compute the expected winning from the jackpot. This depends on the number of players who have the winning numbers. We first calculate the expected share of the jackpot for a player who has the winning numbers. Assuming that the numbers chosen by the buyers are independent, the probability p(k) that there are k winners is given by a binomial distribution with number of trials n = 204 million, the number of tickets sold and p = 1/80,098,128, the probability that a particular ticket will have the winning numbers. Then the expected share of the prize is:
p(1) + p(2)/2 + p(3)/3 + .... = .362
Thus the expected winning for a person who buys a $1 ticket with a 166 million cash payment is
p x 166 million x .362 = .75.
Thus the expected value of a $1 in this lottery was 21 cents + 75 cents = 96 cents.
This would make this lottery a slightly unfavorable game. But of course we will also have to pay state and federal income tax on our winnings and, if we assume that this is 30% of our winnings, our expected winning drops to about 29 cents. Thus, even for this near record jackpot, the Powerball lottery is a quite unfavorable game.
In our Chance profile "Using lotteries in teaching Chance" we discussed the Powerball lottery and carried out these calculations for the record jackpot of 295.7 million on July 29, 1989 and and obtained similar results.
In the above calculation we assumed that the events of two different players picking the same set of numbers are independent. This would be a reasonable assumption if all players used the EP (Easy Pick) option which has the computer randomly pick their numbers. But not all them do this and those who choose their own numbers do not make random choices. We obtained data from the Powerball lottery which included 17,000 numbers picked by the buyers. This was before 1997 when the all numbers were chosen from the numbers 1 to 45. Here is a plot of the frequencies of the numbers chosen.
We see that the numbers are not
equally distributed.
It is generally claimed that people tend to use birthdays to choose their numbers.
This is born out by the fact that the most likely grouping in the graph from
1 to 12 (which could be days or months in a birthday) and the next most likely
grouping 13 to 31 (which could be days in a birthday). This would suggest, for
example, when the winning numbers are mostly large numbers there would fewer
winners than expected if all numbers were chosen by the EP option.
The assumption of independence is not too bad since about 70% of the buyers choose the EP option, and this percentage is probably even higher when the jackpot is huge and people are buying many tickets.
DISCUSSION QUESTIONS:
(1) How large would the jackpot have to be to make the Powerball lottery a favorable game?
(2) The Powerball lottery returned to the buyers about 50% of the amount they took in both before the change in 1997 and after this change. Does this mean that even though it became less likely to win the jackpot the expected winning for a player remained the same?
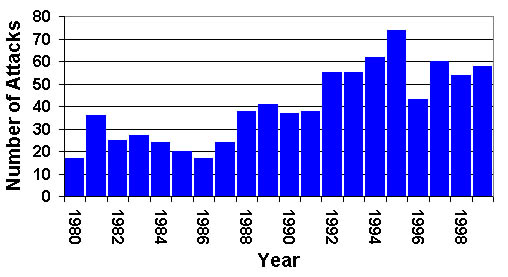
According to Time magazine in a July 30 cover story this has been the "Summer of the Shark."
But not withstanding some highly publicized incidents and two deaths, George Burgess who runs the International shark attack file (ISAF) of the Florida Museum of Natural History says that we are not having an exceptional year. Here is a graph of the global history up to 1999 that the museum provides on its web page:
1980 - 1999 Unprovoked Shark Attacks
WORLDWIDE (N=805)
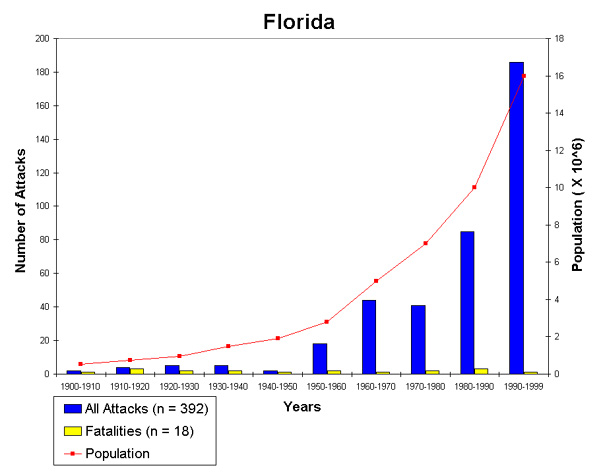
There were 84 shark attacks in 2000 and so far there have been 52 in 2001. This suggests that the number will actually go down this year. On the other hand more than half of these have occurred in Florida. This might be partially explained by the following comment in this article:
Scientists attribute the rise in attacks over the decades to millions more
people going to the beach and the increasing popularity of water sports.
The big attacks this year, they note, came on holiday weekends when
beaches were crowded.
Here is a graph that compares the population growth in Florida with the number of shark attacks in Florida, again from the ISAF web page.
DISCUSSION QUESTION:
The author of the article suggests that perhaps having 2 deaths in the US is unusual, observing that while there were two deaths in 1994, since 1990 there has been six of the 11 years with no deaths. Does this seem convincing to you? How would you decide if the 2 deaths this year is unusual.
DISCUSSION QUESTION:
What are some of the problems in drawing conclusions from data like the number of shark attacks worldwide over a large number of years?
Paulos remarks that simple arithmetic will show that the risk of being attacked by a shark is very small. Paulos provides other risks that are greatly feared but very small, such as getting infected by the West Nile virus, or being abducted by a stranger. He remarks that tragedies though they are, their risk pales in comparison of, for example, alcohol. Paulos carries out the calculation for a couple of examples including air-rage. He remarks that the annual number of incidences involving abusive passengers is about 3,500 and only 10% are serious enough to warrant the airline company taking action against the passenger. Paulos writes:
This may still sound like a dreadful problem. But close to 2 million Americans fly
every day. That's about 700 million passengers annually. . Dividing 700 million
3,500 incidents, or by 350 serious outbursts, we find that about one in 200,000
passengers is involved in any air rage incident annually, and only one in 2 million
is involved in a serious one. . Compare those figures to the behavior and arrest
rates at sporting events, and you'll appreciate what a docile bunch air travelers are.
Paulos suggest that the news media often reports risks in a way to make them seem more dangerous than they are. For example, when reporting the recent fires in the west they reported the area burned in terms of acres. He asks: If we're describing the amount of forest consumed in the fires, which sound worse: 3,100 square miles for 2 million acres? Observing that these are the same he concludes: Often a little arithmetic is enough to counter a lot of anxiety.
DISCUSSION QUESTION:
According to an article in the the Hartford Courant (27 August 2001, D1) David Kelton, professor of management science at Penn State, suggests that the apparent surge in shark attacks in Florida could be explained using the Poisson distribution. What did he mean by this?
Scary? You bet it is: and here's why the risk analysts are no comfort.
Washington Post, 2 September, 2001, Outpost, B1
Fred Barbash
The author started investigating sharks late in the spring before the current well publicized rash of shark attacks on humans. This was the result of a frightening experience he had off the beach at Emerald Isle, N.C. This experience made him worry when he took his 6-year-old son into the surf to go boogie boarding. When the surge of shark attacks began, Barbash said that he became fascinated by the risk analysts and statisticians who "ridicule our fears, hurling statistics as us."
He writes:
My favorite expert was Samuel Gruber, professor of marine biology and fisheries at the University of Miami. He appeared on the front page of the Washington Post, and elsewhere, to remind us that "when it comes to the probability of being hurt by a shark, more people are likely to be killed by pigs, by coconuts, you name it."
Why did I not find this reassuring? Why did this not dampen my fears?
My fear, the marine biologists would tell me, was a Fred problem, not a shark problem. Statistically speaking, he would almost certainly say, I should have been worrying more about a pig attack than a shark attack. To which I would respond that I happened to be visiting an ocean beach, not a farm; and my dilemma was not whether to wallow in a pigsty but rather whether to take my son out in the surf.
Barbash also expresses his discomfort with remarks Paulos made in the article mentioned earlier such as "Often a little arithmetic is enough to counter a lot of anxiety." He says that he has always admired risk analysts and the way they help allocate resources in a sensible way. But while they live in a world of probability and statistical averages, "We live in a world of real people and real emotions".
Barbash observes that often the less the chance of something bad happening to us, the more horrible it seems to be. For example, he says that that is why people made bomb shelters in the 50's even while driving the most dangerous cars ever to roam the highways. Conversely he remarks that the less likely a wonderful outcome becomes, the more desirable it seems to be saying "that is why, as we saw last week, the number of players increases dramatically as the pot of money grows." He might better have said that when winning the jackpot was made more improbable the number of people playing the lottery increased.
He admits this may seem irrational but only because of a difference between what we are worried about and what the risk analyst thinks we should be worried about. For example, the prospect of a shark eating one of his family was not the only thing he was worried about. What really bothered him was that he had gone to the beach for a relaxing experience and he wasn't relaxed and quotes Roosevelt's famous remark, "There is nothing to fear except fear itself".
Turning to averages Barbash remarks:
Statisticians know only the past. And they know it only as an aggregate,
which represents no one, or no one in particular. Indeed the likelihood of
any one person's life experience conforming to the average is slim.
As an example, he mentions the Risk Quiz on the Harvard Center for Risk Analysis home page. From this Quiz we learn that the risk of dying of heart disease is as high as 1 in 385 while the risk of dying from drowning is just 1 in 65,116. Barbash remarks that these odds would be very different for a person who sails every weekend and cannot swim or a person who lives on roast beef and French fries.
Giving another example, he remarks that tens of millions of people invest in stocks because their investment experts tell them that historical averages shows that people who invest in stocks over a long period of time do better than those who invest in government bonds. He says that if they buy stocks for 50 years and then the market crashes they surely are not better off than the fellow who invested in government bonds. For more about this problem see the article "The flaw of averages" by Sam Savage reviewed in Chance News 9.10.
Barbash remarks that veteran stock market fund managers, when asked about this concern often remark "If someone can't sleep at night worrying about their stocks, they shouldn't own them." We have to confess that is exactly what our advisor told us and unfortunately we did not listen to him.
Returning to his shark problem that got him started with all this, he ends with: If worrying about sharks keeps you awake at night when your at the beach, don't go near the water.
Data on Genetically Modified Corn.
The New York Times, September 8, 2001, C p2
Andrew Pollack
New research fuels debate over genetic food altering.
The New York Times, September 9, 2001, 1 p25
Andrew Pollack
These two articles summarize the findings of recent studies on the toxic effects of genetically modified corn, which currently represents about 20% of corn planted in the U.S. The studies were funded by the U. S. Department of Agriculture and a consortium of biotechnology companies; the papers themselves can be found at the Proceedings of the National Academy of Sciences web site (see Early Edition, 14 September, 2001). Based on the results this research, at the end of September the EPA is expected to re-authorize the use of some types of genetically modified corn. The articles give mostly the same information, but it is amusing to compare opening remarks:
The papers . . . could lay to rest one of the biggest controversies
over genetically modified crops. (From Sept. 8 NYT article.)
. . . the debate is far from ended. (From Sept. 9 NYT article.)
The only previous results are from a laboratory experiment at Cornell in 1999, and a field study at Iowa State University last year. Taken together the studies concluded that several varieties of Bt corn (corn genetically engineered to withstand pests) are toxic to monarch butterfly larvae, and that monarchs encounter these toxic effects in the field. Monarchs only lay their eggs on milkweed plants, many of which grow in and around cornfields. Corn pollen, and perhaps other corn plant material, settles onto the milkweed plant during larval development. The new research attempted to determine threshold toxicity levels along with estimates for the probability that monarchs will be exposed to such levels. (Apparently the previous studies didn't do this.)
As reported by Pollack, controversy seems to be focused on how the threshold levels were determined. In particular, critics maintain that parts of the corn plant other than pollen--especially corn tassel material--naturally occur in the diet of monarch larvae, while authors of the new papers consider them to be "contaminants" that arise from mishandling of pollen samples. One of the new studies did compare the toxic effects of pollen with and without corn tassels. It found that survival rates of monarch larvae exposed for four days to Bt11 corn decreased from 100% to 20% ± 13%, and for another variety rates decreased from 92% ± 1% to 17% ± 11%. (The Times reports this as, "When scientists doing the new work left those plant parts in the pollen, some caterpillars died.") None of the new studies examined whether corn tassels or tassel parts are typically eaten by monarch larvae in the field.
Pollack does not address the more complex issue of determining a probability of exposure of monarch larvae to corn pollen, which involves many factors, including estimating pollen deposits and density on milkweed leaves, estimating the temporal and spatial overlap of pollen release and emergence of larvae, and estimating percentage of monarchs that lay eggs in milkweed found in cornfields. Since the probability of exposure estimates are obtained by multiplying these estimates together, these numbers can be quite important. For example, rainfall reduces pollen on milkweed plants by more than 50%. Data from a field that received no rain during the study indicates that pollen accumulated to above threshold toxicity levels. This data does not appear to have been used at all in estimating average pollen densities found on milkweed in cornfields.
True, false, whatever; Physicians
are putting a stop to the publication of misleading drug data.
U.S. News & World Report, 17 September 2001, 72-73
Stacy Schultz
Scholarship, authorship and accountability.
Journal of the American Medical Association, 12 September 2001, Vol. 286, No.
10, 1232-1234
Frank Davidoff MD, et. al.
Almost a decade ago, Cynthia Crossen's book, "Tainted Truth: The Manipulation of Fact in America" warned about dangerous conflicts of interest when corporations get involved in scientific research. The U.S News article reports that major medical journals are now taking editorial stands against the influence that pharmaceutical companies exert over research and publication.
The article reports that 70 percent of the clinical drug trials conducted last year were sponsored by pharmaceutical companies. An example of what can go wrong is provided by the case of Celebrex, a drug now widely used to treat arthritis. Its popularity stems in part from research reported in the Journal of the American Medical Association. Results from a 6-month trial showed that the drug had fewer gastrointestinal side effects than its competitors. But as JAMA editor Catherine DeAngelis later learned, the company actually had 12 months worth of data, and the full data set did not support the findings that were published.
Withholding data from investigators is only one type of abuse. In other cases, companies have designed experiments without input from clinicians, lobbied for favorable interpretation of the resulting data, and sought to block publication of findings that were unfavorable to their products. Of course, investigators need funding, so the pressure to go along with a sponsor's wishes can be hard to ignore. All of this clearly impedes scientific progress.
A joint editorial published this week in 12 major medical journals condemns such practices (the JAMA citation is given above). The editors state that they "will not review or publish articles based on conditions that allow the sponsor to have sole control over the data or to withhold publication...[Research] contracts should give the researchers a substantial say in trial design, access to the raw data, responsibility for data analysis and interpretation, and the right to publish..."
DISCUSSION QUESTION:
If you agree that 70 percent is
an unreasonable proportion of drug studies to be sponsored by corporations,
where else do you think the the money could come from?
Investment dartboard
The Wall Street Journal, 8 Aug. 2001
Georgette Jasen
As described in Chance News 7.10, Wall Street Journal runs a stock prediction contest between the darts and the experts. The goal is to pick stocks that will do well in the near future. Since July of 1990, the contest has been run as follows. Four stock experts each pick a single stock. The dart throwers do just that; they throw darts at a list (that has been put in random order) of all of the stocks that are traded on the three major exchanges.
In 1999 the Journal readers have also were invited to submit a stock and then the Journal picked four of these in a drawing for the next contest.
At the end of six months, the average return for the professionals and the dart throwers are computed. In addition, the return of the Dow Jones Industrial Average is computed. Whichever of these three numbers is greatest wins the contest. The Journal has run overlapping six-month contests continuously since July, 1990
This article reports the following results for the most recent contest and a summary of past contests.
The four pros, who lost an average 17.3%, still came out ahead of the
darts and the Journal readers in the period from Feb.14 through July 31.
Four stocks chosen by Wall Street Journal staffers flinging darts at the
stock tables lost an average 21.2%, while four Journal readers whose
picks were selected from e-mails to the Wall Street Journal Online had
an average 43.8% loss. The Dow Jones Industrial Average, meanwhile,
slipped 2.5% during the same period.Since 1990, the pros have turned in an average six-month investment gain
of 10.4%, compared with an average of just 4% for the darts and 6% for the
Dow Jones Industrial Average. The score is 83 to 51 when the pros are
compared with the darts and 70 to 64 when the pros are compared with
the DJIA.In the 22 contests since readers joined in 1999, the pros' average six-month
investment gain has been 6.8%, compared with .9% for the darts and an
average decline of 2.5% for Journal readers. Meanwhile the Dow Jones
Industrials declined an average of .7%.
DISCUSSION QUESTIONS:
(1) Does the score 83 to 51 for the pros vs. the darts indicated a significant difference between the two groups? How about the score 70 to 64 for the pros vs the darts?
(2) What information would you have to have to check if the corresponding percentage gains are significant?
News and Numbers: A guide to reporting
statistical claims and controversies in health and other fields.
Iowa State University
Press, 2001, paperback, 212 pp, $24.95
Victor Cohn, Lewis Cope
Victor Cohn was a science writer for the Minneapolis Star Tribune for 20 years
and then, for 21 years, a science writer for the Washington Post. His reporting
was awarded just about all the journalists' highest awards for science writing.
Hi reporting resulted in significant changes in public policy. He has often
been called "The Dean of Science Writers". At age 79 Victor was diagnosed
with a fatal disease. At that time he was in the middle of revising his book
"News and Numbers" written in 1989 to help his fellow journalists
understand and accurately report statistical issues. He enlisted the help of
long time-colleague Lewis Cope, former science writer for the Star Tribune,
to assist him in completing the book. Victor died at age 80 and, thanks to the
work of Lewis Cope and his daughter Deborah Cohn Runkle, we have the second
edition of his book.
Victor starting writing the first edition of this book when he was a fellow
in residence at Harvard's School of Public Health. His mentor was Fred Mosteller.
His experience working with Fred led him to consult other experts in statistical
research and to include their advice in his book. This is a small book by modern
standards and would win a prize for the density of wisdom per page among books
on statistics. Here are a few paragraphs from randomly chosen pages to give
you a flavor of the book:
Page 15, Chapter 3, Testing the evidence.
A father noticed that every time any of his 11 kids dropped a piece of
bread on the floor, it landed with the buttered side up. "This utterly
defies the laws of chance," the father exclaimed.He just needed to ask one good question: Is there some
other explanation for this buttered-side-up phenomenon?
Close examination disclosed that his kids were buttering
both sides of their bread.Experts call this the failure to consider an alternative
explanation. We call it the need for clear thinking.
Editor's note: Of course Ignoble
prize winner Robert Matthews would have had a another explanation
(See
Chance News 5.04).
Page 16, Chapter 3, Testing the evidence.
Someone might look at professional basketball players and
conclude that this sport makes people grow tall. Or look at
the damage wreaked on mobile home parks by tornadoes,
then conclude that mobile home parks cause tornadoes.
Experts call this falsely concluding that association proves
causation. We just call it crazy thinking.Page 40, Chapter 4, What's a good study?
The big problems of statistics, say its best practitioners, have
little to do with computations and formulas. They have to do
with judgment--how to design a study, how to conduct it,
then how to analyze and interpret the results.
Page 71, Chapter 5, Questions you can ask.
Do the conclusions fit other evidence?Are your results consistent with other experimental findings
and knowledge in the field? If not, why? Have your results
been repeated or confirmed or supported by other studies?Virtually no single study proves anything. Consistency of
results among human trials, animal experiments, and laboratory
tests is a good start. Two or more studies in humans can build
even more confidence.One scientist warns, however, "You have to be wary about a
grab bag of studies with different populations and different
circumstances." To this Mosteller adds, "Yes, be wary, but
consistency across such differences cheers me up."Page 123, Chapter 9, Our environment and measuring all risks.
From a checklist prepared by Peter Montague at Princeton University:
When you are told about "safe averages," remember that we
encounter hazards as individuals or groups. If an industrial plant
releases a toxic substance, the most important thing is not the
average amount that gets in the air, but the amount downwind of
the plant where people will breathe it. Ask: What does this mean
to individuals? To your community?
When you are told "there is no evidence of hazard," ask: What
would you do? Would you eat or drink it? Would you raise your
children in its presence? What do you think the public should do?
When your are told about risk-benefit, or cost-benefit analysis ask:
who bears the risk? Who pays the costs? Who gets the benefit?
Have those who bear the risk given their informed consent?Page 173, Chapter 11, Politics, your pocketbook, any plenty more.
Back in 1974, Evel Knievel was about to attempt to jump over
the Snake River Canyon in a rocket car. The car's designer told a
TV reporter that Knievel had about an 80 percent chance of success."That good" replied the TV reporter, apparently coming into the interview
fearing the worst."Good?" shot back the designer, "You think that's good?"
Remember: Risk perception varies from one person to another.
In addition to bringing the book up-to-date with current research and statistical methods the authors have included two new chapters: "Health plans and Hospitals" and "Polls".
This book is written by science writers whose job it is to give the general public interesting, understandable, accurate and succinct accounts of difficult ideas. In this book the authors practice what they preach. Those interested in improving their statistical literacy or their teaching of statistical literacy will also profit from reading this book. There is no math, just a lot of common sense.
State Violence in Guatemala: A Quantitative Reflection by Patrick Ball, Paul Kobrak, and Herbert F. Spirer, English and Spanish editions available.
Making the Case: Investigating Large Scale Human Rights Violations Using Information Systems and Data Analysis. Edited by Patrick Ball, Herbert F. Spirer, and Louise Spirer.
These books are published by the AAAS and are available in pdf format from AAAS's Science and Human Rights Data Center.
The first book documents the state violence in Guatemala from 1960 to 1996. Graphs are used to illustrate trends in the number of killings and disappearances by regime, as reported by the press, urban vs rural, by gender, age, by numbere committed with civil patrol participation, etc. The text gives a running account of the circumstances leading to these violations providing a complete documentation both for trials of those responsible for the violations and for historical records. While some statistical analysis is made in the book, the data is available here so that students interested in this topic can make their own analysis.
The second book is essentially a primer on how to collect data related to human rights violations. It consists of a collection of 10 papers written by experts in the field of human rights. They provide case studies of human rights data collection in different countries including Guatemala, Haiti, South Africa, and Salvadore. Each paper includes a section on lessons learned, discussing problems, solutions and recommendations for future studies.
The articles provide interesting discussions of the problems in collecting data in difficult circumstances and the problems in developing uniform methods that will provide data that will stand up in court and provide an honest historical record. Each paper includes a section on "Lessons Learned," discussing problems, solutions, and recommendations for others collecting this kind of data.
Herbert Spirer is also a co-author of an excellent book on the misuse of statistics:
Misused Statistics.
Second Edition, Revised and Expanded
Herbert Spirer, Louise Spirer, Abram Jaffe
Dekker, 1998, 280 pp. Hardcover $55
Our library has this book as an e-book using the netlbrary company. This was our first experience reading a book on a computer. Most people seem instinctively not tot want to read a book this way but we found it an enjoyable experience and being able to search the book is nice. You are allowed to copy only one page at a time, so you pretty much have to read it on your screen. Also you can check it out for only 4 hours so we had to check our book out more than once.
Dartmouth at least has an interesting method of deciding which of the many e-books available from the netlibary it wants to buy (have a site license for one person at a time to read it). A user can browse any book in the netlibrary catalogue but if he checks it out the library has bought it!
DISCUSSION QUESTION:
Do you think that Dartmouth's consumer
driven e-book collection will work?
--------------------------------------------------------------------------------
Copyright (c) 2001 Laurie Snell
This work is freely
redistributable under the terms of the GNU
General
Public License published
by the Free Software Foundation.
This work comes
with ABSOLUTELY NO WARRANTY.
!!!!!!!!!!!!!!!!!!!!!!!!!!!!!!!!!!!!!!!!!!!!!!!!!!!!!!!
CHANCE News 10.08
August 14 , 2001 to September 18, 2001
!!!!!!!!!!!!!!!!!!!!!!!!!!!!!!!!!!!!!!!!!!!!!!!!!!!!!!!