CHANCE News 13.05
June 8, 2004 to November 1,2004
Prepared by J. Laurie Snell, Bill Peterson, Jeanne Albert, and Charles Grinstead with help from Fuxing Hou and Joan Snell. We are now using a listserv to send out notices that a new Chance News has been posted on the Chance Website. You can sign on or off or change your address at here. This listserv is used only for this posting and not for comments on Chance News. We do appreciate comments and suggestions for new articles. Please send these to jlsnell@dartmouth.edu.
The current and previous issues of Chance News and other materials for teaching a Chance course are available from the Chance web site.
Chance News is distributed under the GNU General Public License (so-called 'copyleft'). See the end of the newsletter for details.
I returned, and saw under the sun, that the race [is] not to the swift, nor the battle to the strong, neither yet bread to the wise, nor yet riches to men of understanding, nor yet favour to men of skill; but time and chance happeneth to them all.
Ecclesiastes 9.11
Contents of Chance News 13.05
(1) Two Forsooths and a Forsooth of
a Forsooth.
(2)Why pollsters cannot agree.
(3) One seat left. Is it yours?
(4) A good graphic?
(5) The politics of terrorist warnings.
(6) Olympic predictions-the Chance class vs the experts.
(7 )The Chance Manifesto: registering clinical trials.
(8) The Smoking Puzzle: Information, Risk Perception
and Choice.
(9) The wisdom of crowds.
(10) Answer to the" lost boarding pass puzzle".
Here is a Forsooth item from the September 2004 issue of RSS News:
Drinking water across England and Wales meets 99.88% of all national and
EU standards, according to a report by the Drinking Waster Inspectorate
(DWI).
The Inspectorate's 14th annual report, published today, reveals that 99.88%
of 2.9 million tests carried out in 2003 met all the national and EU drinking
water standards. The number of tests failing to meet standards was only
3,428 compared to more than 25,000 failures a decade ago.
BBC News website
7 July 2004
Norton Starr observed that there is more wrong with this than meets the eye.
At the time of Ronald Reagan's funeral, Todd Doers sent us this Forsooth and explained why it merits this title.
We inaugurate a president every four years. How often do we bury one?
Financial Times, June 9, 2004
James Jackson
Mr. James Jackson is the recently retired commanding general
for the US Army Military District of Washington, which oversees presidential
funerals. His point was that it is a very rare occurrence, much rarer
than inaugurations. But how rare is it really? Although the last presidential
burial was 10 years ago (Nixon), and the one before that was 21 years
earlier (Johnson), shouldn't average or expected elapsed time between
presidential burials be the same as the average elapsed time between changes
in presidents (adjusted maybe for a gradual increase in life expectancy
through history)? I found that the average elapsed time between presidential
burials has actually been 5.7 years. Since Bush is our 43rd president
since 1789, the average elapsed time between changes in president has
been 5.0 years. I imagine one of your students could tell us how surprised
we should be at the difference of about 8 months. Not nearly as surprised
as Mr. James Jackson, I bet.
Don Granberg sent us a forsooth of a forsooth. In Chance news 11.02 we reported that John Paulos and Dan Seligman noticed a forsooth in William Safire's June 25, 2001 column in the New York Times where he presented the following odds for various prominent Democrats winning the Democratic presidential nomination in 2004.
| Al Gore |
2 to 1
|
| Joe Lieberman |
5 to 1
|
| Tom Daschle |
4 to 1
|
| Dick Gephardt |
15 to 1
|
| Joe Biden |
5 to 1
|
| John Edwards |
9 to 1
|
| John Kerry |
4 to 1
|
| Pat Leahy |
6 to 1
|
| Chris Dodd |
4 to 1
|
| Russell Feingold |
8 to 1
|
In his article Paulos pointed out that, when we transform these into probabilities they have a sum of 1.68. Dan Seligman made a similar observation in his article Why Journalists Can't Add in Forbes Magazine. But Granberg reminds us that when bookies make odds it is standard practice to have the corresponding probabilities add to more than one. Indeed, that is how the bookies make their money. And when presenting these odds, Safire writes: "Here is the early-morning line handicapped by one right-wing tout." So Safire is referring to gambling odds. Admittedly a probability of 1.68 would be a pretty greedy bookie but since Safire is probably the bookie that's his privilege. Granberg checked a number of gambling odds and found, for example, that the odds for the 32 NFL football teams winning the 2005 Superbowl added up to 1.31 which he thought was a bit excessive.
Bush? Kerry? Why pollsters cannot agree.
The New York Times, October 19, 2004, Page 1
Jim Rutenberg
While the headline of this article suggests that recent presidential
polls have produced significantly different results, by the fourth paragraph
the author admits that "the actual findings of these polls may not
be so different." To help explain these apparent differences, several
potential factors are mentioned, including political motives by pollsters,
survey methodology, caller ID systems that can easily screen incoming
calls, and increasing cell phone use (cell phones are not included in
random phone samples). The main focus of the article, however, is the
different ways that pollsters attempt to determine if a person will actually
vote.
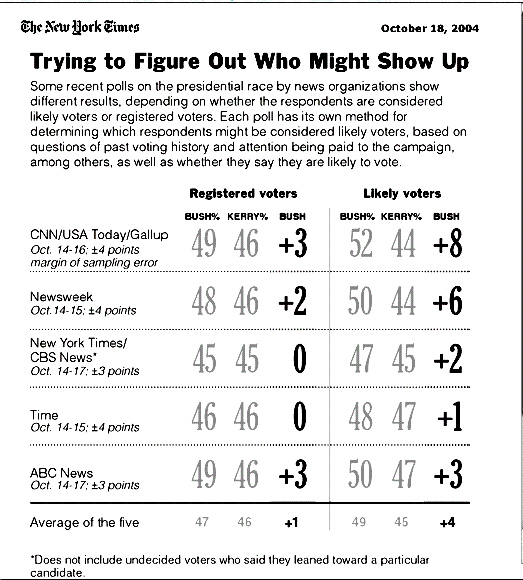
Most political polls report the responses of either registered voters or "likely" voters. A chart that accompanies the article first displays, for five recent polls, the percentages of registered voters that favor Kerry and that favor Bush. The results range from equal percentages for each candidate to a 3% lead for Bush. As noted in the article, in each case the gap between the percentages for each Candidate are within the margin of error (3 or 4%) of the given poll.
Next, the chart displays the results for "likely" voters, which show greater gaps between the percentages favoring each candidate. Although for three polls the gaps are still within the margin of error, the remaining two report more dramatic differences: an eight-point lead for Bush in the CNN/USA Today/Gallup poll (up from a three-point lead among registered voters), and a six-point lead for Bush in the Newsweek poll (up from a two-point lead.) All the polls were conducted over two to four days during the period October 14 to October 17.
How do the different polling organization determine who is a "likely"
voter? And how might different methods produce such apparently different
results? While the exact procedures are not described, the article does
indicate some differences between the methods used by Gallup and by the
New York Times/CBS poll. (The former poll reports 49% for Bush
and 46% for Kerry among registered voters; for "likely" voters
the figures are
52% Bush, 44% Kerry. The latter poll has Bush and Kerry tied at 45% among
registered voters; among "likely" voters it's Bush 47%, Kerry
45%. (These figures have undoubtedly changed by the time you are reading
this.) Both organizations use responses to questions about, for example,
voting history and relative interest in the election, as indicators of
voting likelihood. Gallup uses these responses to gauge voter turnout,
and "after estimating what the actual turnout will be," the
article states, "Gallup includes the preferences of just that fraction
of their respondents. The New York Times and CBS, on the other hand, include
responses from all those determined to be likely voters, but gives some
of their votes more weight than others," depending on the level of
likelihood indicated. Unfortunately, without further information, it is
difficult to gauge the potential impacts of the two methods.
The pollster John Zogby has recently raised two issues not discussed in this article: the effect of differing distributions of Republicans, Democrats, and Independents across different polls, and response rates.
Polls from early September by both Time and Newsweek showed 11% leads for Bush, while Zogby's poll had Bush ahead by 2%. (See "2004: It is not an 11 point race" . ) Zogby concludes that this difference derives from the distribution of party affiliation in the samples. According to Zogby, the Newsweek poll of registered voters consisted of 38% Republicans, 31% Democrats, and 31% Independents. On the other hand, Zogby's organization weights each party to reflect the party distribution in recent presidential elections: 35% Republicans, 39% Democrats, and 26% Independents. (This is the same as the distribution that Zogby gives for 2000; for 1996 he has 34% Rep., 39% Dem., 27% Ind.) While Zogby is clearly not a disinterested party, his point is worth exploring and it is surprising (or is it?) that the Times article missed it.
Except for comments regarding the prevalence of caller ID systems and cell phone use, the Times article does not discuss response rates. In a recent lecture given at SUNY Potsdam, Zogby remarked that when he started his polling career, response rates were around 60%. Today, he said, they are under 30%, and only 8-10% in metropolitan areas. (Audio of the lecture is available here. Response rates were discussed during the Q&A, which is in a separate audio file on the same site). He also noted that his organization has been developing "interactive", or internet polling methods, and that he expects polling to move in this direction.
One such national poll is already up and running: the YouGov poll, commissioned by the Economist magazine, which uses a panel of 10,000 e-mail addresses from which it selects its samples. (More information about their methods and results, including an overview of current problems with phone surveys, is available at the Economist website.)
Puzzler:
One seat left. Is it yours?
Car Talk, 4 October 2004
This week's Car Talk puzzle asked:
One hundred people line up to board an airplane, but the
first has lost his boarding pass and takes a random seat instead. Each
subsequent passenger takes his or her assigned seat if available, otherwise
a random unoccupied seat.
You are the last passenger. What is the probability that you get your own seat?
You and your students would enjoy this puzzle if you have not seen it before. It has not made Marilyn's column yet but it is in Peter Winkler's very nice new book: Mathematical Puzzles: A Connoisseur's Collection where it is called "The lost boarding pass puzzle." You can find the solution to this puzzle at the end of this Chance News.
This puzzle also appeared in the March/April 2003 issue of the Journal Contingencies. This journal is published quarterly by the American Academy of Actuaries and includes a puzzle column edited by Noam Segal. Not surprisingly, these puzzles often involve probability or statistical concepts.You can see the current puzzle and the answer to the previous puzzle at the Contingencies website. Earlier puzzles are archived at the Nebraska Actuaries Club website. You will find other questions relating to the lost boarding pass puzzle in the May/June 2003 issue and the solutions to these and the original puzzle in the July/August, 2003 issue. We include two of these in our discussion questions.
DISCUSSION QUESTIONS:
(1) What is the expected number of people who get their own seats?
(2) Under the same conditions as the original problem what is the probability the last person gets his/her own seat if the first two people lose their boarding passes?
The impact of No Child Left Behind (graphic).
New York Times, 17 August, 2004
This data graphic appeared in the Times. It is intended to compare two variables at the state level: percentage of schools facing penalties under the No Child Left Behind Act, and percentage with fourth graders not meeting the basic reading standard.
DISCUSSION QUESTIONS:
1. Do you understand think the graphic makes the intended comparison clear? Can you suggest another way to present the data?
2. What consequences might there be in aggregating the data in this way?
The politics of terrorist warnings (Or, who's afraid of orange alerts?).
Washington Post, 5 September 2004, B05
Richard Morin
In this election year, the threat of terrorism has been widely viewed as a plus for the Bush campaign. Darren Davis and Brian Silver,two political scientists from the University of Michigan researchers, have questioned this view in a paper entitled The Threat of Terrorism, Presidential Approval, and the 2004 Election.
Their study examines the relationship between President Bush's approval rating and public fears of terrorism. It draws on two national surveys and a series of surveys done in Michigan between 2001 and 2004. In 2001, after the 9/11 attacks, people who expressed higher levels of concern about terrorism were more likely to approve of the President. In 2004, however, there is evidence that the association may have reversed direction. The Post article reports that:
In the latest Michigan statewide survey, completed in June, 64 percent of those who were "not at all concerned" about terrorism approved of the job Bush was doing as president. But among those who were "very concerned" about the possibility of another terrorist attack, only 26 percent thought the president was doing a good job... .
The researchers also report that while the government's system of color-coded terror warning does affect people's perception of the threat level, the posting of new warnings does not appear to affect the President's approval rating.
Economists
venture
Olympic predictions.
NPR, Morning Edition, 9 Aug. 2004.
Predicting
countries' medal counts at the olympics.
Morning Edition, 1 Sept. 2004
John Vdstie
Medal Miscount
Slate Magazine, August 30, 2004
Daniel Gross
In their article
"Going for the gold: Who will win the 2004 Olympic games in Athens?"[1]
Andrew B. Bernard, Meghan R. Busse, July, 2004, the authors write:
Even with the opening ceremony of the 2004 Athens Olympic
Games more than two weeks away, we already know who will win. Building
on their remarkably accurate medal forecasts for the 2000 Sydney Olympics,
Professors Andrew Bernard of the Tuck School of Business at Dartmouth
and Meghan Busse of the Haas School of Business at UC Berkeley have once
again predicted Olympics medal totals for 34 countries.
In an article recently published in the Review of Economics and Statistics,[2]
the authors describe the details of their medal prediction method. Bernard
and Busse show that over the last 40 years, national Olympic medal totals
have been driven by four distinct factors: population, per capita
income, past performance, and a host effect.
The Bernard and Busse predictions were widely discussed in newspapers, on the radio and on the internet. Some news articles referred to Bernard as the Wizard of Odds, evidently not realizing that Michael Shackleford is already The Wizard of Odds.
Professor Bernard gave a guest lecture in the Dartmouth Chance course in the Fall of 2000 in which he explained the method they used and their predictions for the 2000 summer olympics. He explained that they used a form of regression with variables including population, income per capita, gross domestic product and previous performance, as well as variables to measure certain special advantages a country has from, for example, being the host country or of being a country of the former Soviet Union.
On the day after the lecture, the instructor Greg Leibon asked the students to divide into groups and decide how they would have predicted the outcome of the Olympics. Several groups concluded that they would simply predict that a country would get the same number of medals that they won in the previous summer Olympics. So Greg and the class tried this and were surprised to find that the results by this method of prediction,which we will call the Chance class method, were as good as those obtained by Bernard and Busse. We showed the comparison between the Bernard-Busse prediction with the Chance class prediction in Chance News 9.10. Of course we could not resist checking to see if the Chance class method would work equally well for the 2004 Olympics
In [2] Bernard and Busse give their predictions for all countries that won 6 or more medals in the 2000 Olympics. Here is the relevant data for the 2004 Olympics to compare the Bernard- Busse predictions with the Chance class predictions.
Country |
Medals
won 2004 |
Bernard-Busse
prediction |
Medals
won in 2000 |
Bernard-Busse
absolute error. |
Chance
class absolute error |
United States |
103 |
93 |
97 |
10 |
6 |
Russia |
92 |
83 |
88 |
9 |
4 |
China |
63 |
57 |
59 |
6 |
4 |
Germany |
48 |
55 |
57 |
7 |
9 |
Australia |
49 |
54 |
58 |
5 |
9 |
France |
33 |
37 |
38 |
4 |
5 |
Italy |
32 |
33 |
34 |
1 |
2 |
UK |
30 |
27 |
28 |
3 |
2 |
Greece |
16 |
27 |
13 |
11 |
3 |
South Korea |
30 |
27 |
28 |
3 |
2 |
Cuba |
27 |
25 |
29 |
2 |
2 |
Romania |
19 |
23 |
26 |
4 |
7 |
Netherlands |
22 |
21 |
25 |
1 |
3 |
Ukraine |
23 |
20 |
23 |
3 |
0 |
Japan |
37 |
19 |
18 |
18 |
19 |
Hungary |
17 |
14 |
17 |
3 |
0 |
Belarus |
15 |
13 |
17 |
2 |
2 |
Canada |
12 |
13 |
14 |
1 |
2 |
Poland |
10 |
12 |
14 |
2 |
4 |
Brazil |
10 |
12 |
12 |
2 |
2 |
Spain |
19 |
11 |
11 |
8 |
8 |
Sweden |
7 |
11 |
12 |
4 |
5 |
Bulgaria |
12 |
10 |
13 |
2 |
1 |
Norway |
6 |
8 |
10 |
2 |
4 |
Switzerland |
5 |
8 |
9 |
3 |
4 |
Czech Republic |
8 |
6 |
8 |
2 |
0 |
Mexico |
4 |
6 |
6 |
2 |
2 |
Indonesia |
4 |
6 |
6 |
2 |
2 |
Ethiopia |
7 |
5 |
8 |
2 |
1 |
Kazakhstan |
8 |
5 |
7 |
3 |
1 |
Denmark |
8 |
5 |
6 |
3 |
2 |
Kenya |
7 |
4 |
7 |
3 |
0 |
Jamaica |
5 |
3 |
7 |
2 |
2 |
Georgia |
4 |
3 |
6 |
1 |
2 |
| Average | 4 |
3.56 |
We see the the Chance class method did slightly better on the average absolute error. Another measure of success suggested by Barnard and Russe is the correlation between the number of medals predicted and the number won. Using the above data we obtain a correlation of .976 for Barnard-Busse and .977 for the Chance class. Thus, by these two measures, the two methods of predictions appear to be equally effective in predicting the number of medals won.
Similar predictions for the 2000 and 2004 summer olympics were made by Dan Johnson and Ayfer Ali[4]. Johnson and Ali use economic and political variables similar to those used by Bernard and Busse except for the important difference that they did not use outcome of the previous olympics as a variable. They wanted to concentrate on the ability to predict the outcomes from political and economic variables.
Still a third study was referred to in the Slate article. It was carried out by John Hawksworth, Jon Bunn, and Kate Alexander of PricewaterhouseCoopers in the UK. These authors used political and economic variables similar to the other studies and also included previous olympic performance. Unfortunately, they do not provide the details of their regression.
Each study had its own way to determine which countries to use to test their predictions. The Barnard-Russe study chose all those countries who won at least 6 medals in the previous summer olympics which gave them 34 countries. The PwC study chose the top 30 countries according to it's own predictions. The Johnson-Ali study had predictions only for countries for which they were able to get the economic and political data needed for their regression. In comparing the Chance class predictions with those of this study, we compared predictions for countries for which Johnson-Ali study the required data and that won at least 4 medals in the previous summer olympics. This gave us 30 countries for this comparison. We used the correlation R and the mean absolute error to compare each studies' predictions with the Chance class predictions for the same group of countries. Since the studies do not use the same countries for their predictions, the Chance class had different results for each of the three studies. Here are the results:
Bernard Busse |
Chance class |
PwC |
Chance Class |
Johnson |
Chance class |
|
Correlation R |
.976 |
.977 |
.970 |
.971 |
.913 |
.977 |
Mean absolute error |
4 |
3.56 |
6.9 |
3.8 |
7.97 |
3.87 |
We see that the Chance class always does slightly better on the correlation and perhaps significantly better on the mean absolute error. Note that the Johnson Ali predictions have an impressive correlation even without using previous performance. Unlike the others Johnson and Ali also look at the winter olympics and make comparisons with the summer olympic. They are also are the only ones who explained their methodology in a way that we could understand.
References.
(1)
Going for the gold: Who will win the 2004 Olympic games in Athens?
Andrew B. Bernard, Meghan R. Busse, July, 2004
(2)
Who wins the olympic games: Economic resources and medal totals.
The Review of Economics and Statistics, February 2004, 86(1):413-417
(4)A
Tale of Two Seasons: Participation and Medal Counts at the Summer and
Winter Olympic Games
To appear December 2004 in Social Science Quarterly.
Daniel K.N. Johnson and Ayfer Ali
January 2002
The
Chance Manifesto.
Draft Version .3, 2 June 2004
Peter Doyle
Clinical
trial registration: A statement from the International Committee of
Medical Journal Editors.
New England Journal of Medicine, 351;12, 16 September 2004
Medical
journals want more transparent research data.
NPR: Talk of the Nation, 10 September, 2001
Ira Flatow with Guest Dr. Catherine DeAngelis, editor-in-chief JAMA
Legislators
propose a registry to track clinical trials from start to finish.
Science, Vol 305, Issue 5691,1695, 17 September 2004
Jennifer Couzin
In his Chance Manifesto, Peter gives an example to show the difficulty in assessing the value of a statistical experiment without knowing what the experimenter planned to do before the experiment was conducted. Peter proposes that this information should be made publicly available. He writes
Now the interesting thing is that there is already a mechanism in place for registering in advance of a study what data is to be collected and how the data is to be analyzed. This mechanism is mandated by the federal government for any studies involving human subjects funded by the US Department of Health and Human Services, and separately, for studies of any drugs, medical devices, etc. regulated by the Food and Drug Administration. This means that investigators are already being forced to commit themselves in advance to how they are going to run their experiments
Peter then discusses why a researcher might want this information to be made publicly available. He writes
If I were a funding agency, or a reviewer for a funding
agency, I would look kindly on investigators who have an established policy
of archiving the plans of their investigations in advance. Such a policy
would impress me as a sign of honorable intent, and just as important,
it would give me a way to check over their track record. Turning from
the investigator to the particular investigation, I would look kindly
on proposals whose study plans were either already archived, or (more
likely) where there was a commitment to archive the plans before the start
of the study. In fact, if I were in a position to do so, I would make
funding contingent on pre-archiving any study paid for in whole or in
part with the funds being allocated.
Other parties who could benefit from a pre-archiving scheme would be the
journals where results of studies are published. If I were a medical journal
editor, I would look kindly on studies that were archived in advance.
In fact, if I were an editor, I would consider for publication only studies
archived in advance, and if I were a reviewer, I would consent to review
only studies that had been archived in advance.
As if they had been listening to Peter, the International Committee of Medical Journal Editors (ICMJE) representing eleven prestigious Medical Journals including the New England Journal of Medicine, Journal of the American Medical Association, and Lancet, announced that member journals of the ICMUE will, as a condition of consideration for publication, require registration in a public trials registry at or before the onset of patient enrollment. You can find their statement here. In describing the requirements for the registry we read:
The ICMJE does not advocate one particular registry, but its member journals will require authors to register their trial in a registry that meets several criteria. The registry must be accessible to the public at no charge. It must be open to all prospective registrants and managed by a not-for-profit organization. There must be a mechanism to ensure the validity of the registration data, and the registry should be electronically searchable.
An acceptable registry must include at minimum the following information: a unique identifying number, a statement of the intervention (or interventions) and comparison (or comparisons) studied, a statement of the study hypothesis, definitions of the primary and secondary outcome measures, eligibility criteria, key trial dates (registration date, anticipated or actual start date, anticipated or actual date of last follow-up, planned or actual date of closure to data entry, and date trial data considered complete), target number of subjects, funding source, and contact information for the principal investigator.
To our knowledge, at present, only www.clinicaltrials.gov, sponsored by the United States National Library of Medicine, meets these requirements; there may be other registries, now or in the future, that meet all these requirements.
ClinicalTrials.gov, founded by the NIH with the FDA, was a result of the 1997 FDA Modernization Act (FDAMA). This act required that clinical trials related to life threatening illnesses be registered and be available to the general public so that people with these illnesses could find out how to enroll in a related clinical trial. The Act defined a clinical trial as "a research study in human volunteers to answer specific health questions" and so includes observational studies, trials with or without control groups etc. Also it has been expanded and is not limited to trials relating to life threatening-illnesses. It is a very well-run register and currently has listed about 11,000 studies.
However the FDA Modernization Act did provide an enforcement mechanism so it does not include all the trials that the law requires. A review by FDA staff showed that between January and September 2002, 91% of government-sponsored cancer studies that fall under the Act had been registered, as compared with 49 percent of industry-sponsored trials.
In the NPR Talk of the Nation program Catherine DeAngelis, editor-and-chief of JAMA explains why the Journals were led to their new policy and the information they will require in the registration. She was asked by Ira and by listeners if they are also requiring that the results of the study be made available. DeAngelis said no that that they did not feel that they could require this. She said that they do not expect the public to use this registration but it will permit the editors, when they receive a paper, to see what other studies have been started and they will then be able to find out from the principle investigator the results of these studies. This will help them decide if a paper should be accepted, and if accepted, it will help the editors provide, in an editorial, the significance of the study in the context of the results of other related studies. This did not satisfy one of the listeners.
The issue of the public's right to know the outcomes of studies was also in the news because of the controversy over the question of the use of antidepressant drugs in the treatment of children.
The New York State attorney, Eliot Spitzer, sued the British drug company GlaxoSmithKline charging that the company had not disclosed the results of clinical trials of their antidepressant drug Paxil that failed to show the drug was effective in treating children and adolescents and that suggested a possible increase of risk of suicide. The suit was based on the results of three studies paid for by GSK to see the effect of Paxil on treating major depression in in children and adolescents.
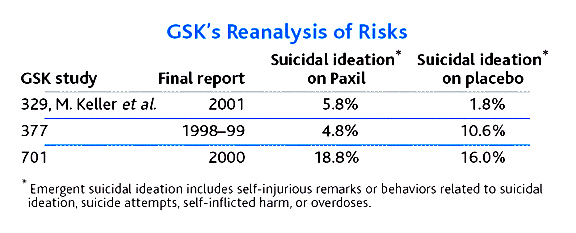
Only study 329 was published. The suit claimed that none of the results were significant and charges GSK with publicizing the apparent favorable study 377 and suppressing information about the other two studies that suggested that the drug had no effect on behavior related to suicides. Spitzer provided internal memos and letters to Doctors to support this claim. You can find their lawsuit here. The suit was settled in September with the company paying 2.5 million dollars and agreeing to post online both negative and positive results from its clinical drug trials.
These developments led Representatives Edward Markey and Henry in the House and Senators Chris Dodd and Edward Kennedy in the Senate to plan to introduce legislation that would require pharmaceutical companies to post clinical trial information publicly. They are proposing requiring the posting of information similar to that required by the Medical Journals but also requiring that the results be promptly reported. The legislation proposed by Markey and Henry is available here.
DISCUSSION QUESTIONS:
(1) An article available here discusses first amendment issues related to requiring companies to post results of their studies. The article concludes with the remark:
Compulsory disclosure of all clinical trial results poses a real danger that pharmaceutical companies will simply cut short those tests that might be headed toward negative or inconclusive results, to the detriment of medical science in the short term and in the long run to the public health in general. The Spitzer Complaint and any others to follow are simply ill-conceived.
Do you think this is a concern?
Paul Meagher provided the next article. Paul has an interesting web site phpmath. Since PHP has not yet become a household word we asked Paul to write a one sentence description of PHP and his site. He wrote:
PHP is a popular opensource programming language that is particularly suited for server-side Web application programming. The goal of the opensource site www.phpmath.com is offer a library of high-quality PHP source code for mathematical programmers often with a view towards use in Web applications.
A good example of how PHP is used to solve a statistical problem related to the web can be found at Conduct Web experiments using PHP, Part 1.
But on to Paul's contribution. Paul reviews the following book:
The
Smoking Puzzle: Information, Risk Perception and Choice.
Harvard University Press, May 2003, 288 pages, $55
Frank A. Sloan, V. Kerry Smith, Donald H. Taylor, Jr.
Why do people persist in a self-destructive behavior such as smoking?
Depending on your background, you will regard the possible answers (e.g., addiction, genetic predisposition, peer pressure, stress relief, weight control, utility maximization, etc...) as more or less self-evident. If you are an economist, then answering this question will require you to develop new conceptual tools because of the implausibility of standard utility maximization theory. Nobel prize winning economist, Gary Becker1, is credited with providing economics with the conceptual resources to explain such behavior as a potentially rational economic activity. This is an important theoretical development because bringing the full power of economic theory to the theory of addictive behaviors offers the potential to clarify the theoretical basis of the field. If the assumption is made that smoking behavior is potentially rational, then the derivation of rationally warranted and testable consequences is possible using fairly standard utility maximization choice models augmented with Becker's preference functions. If you do not make this assumption, then your ability to deduce warranted and testable consequences from your theoretical constructs is arguably diminished. Rational choice is the lens though which many economists view the world and it is the lens that most influences government policy on smoking.
The "Smoking Puzzle" offers readers insight into the work of a community of economists who are thinking deeply about rational choice models that should be used to explain the data on smoking and other addictions. The choice models developed in this book are based on reanalysis of data arising from an impressive panel study on retirement lifestyle2 that repeatedly surveyed a large representative sample of late middle-aged adults in 4 equally spaced "waves" from 1992 to 1998. The authors also did their own follow up focus groups with smokers and former smokers to gain more insight into the information processing, risk perception, and choice aspects of smoker decision making. Their research highlights the importance of "health shocks" as one of the major determinants of smoking cessation in older smokers (51 and older). It also highlights the importance of longevity calculations and the information and reasoning smokers might be using to assess 1) the probability of living for x more years, and 2) the probability that their quality of life will not be appreciably diminished. Heavy smokers are often overly optimistic on both counts. The authors argue that smokers may not be recognizing the early signs of impending health shocks and that government smoking cessation programs might key in on this area because smoker's risk calculations are heavily affected by personalized information as contrasted with publicly available information about health risks which smokers are often well aware of.
The book also contains useful historical discussion on the evolution of government policy on smoking. In the 70s and 80s, North American policy on smoking might best be described as paternalistic because the powers that be felt that their citizens would not be able to assimilate the data that government smoking researchers had access to. In the 90s we started to get the warnings on cigarette packages about the assorted perils of smoking. In the 2000's we now have to ask whether these cessation programs are working.
The answer would appear to be a work in progress as the policy and programs are evolving as new data comes. Such data is amply reported in this book.
One policy direction that might be interesting would be a "numbers-based" policy that would begin by providing the public with quantitative information on mortality so that they have a clear and rational understanding of the longevity risks associated with smoking. Two such tables appear in this book and might be recommended as possible candidates for cigarette packages. The first table is a smoking transition matrix covering each of the 4 waves from 1992 to 1998. I have elected to reformat their sideways branching transition matrix table as 3 separate transition matrix tables that I believe cigarette consumers might be able to digest more easily.
Note that sample ages varied between 51 and 65 at the start of Wave 1. Also, a smoker was defined as someone who smoked 100+ cigarettes in the last year.
Table 1. Wave 1 (1992) to Wave 2 (1994) transition matrix.
| Wave 2 | ||||
|---|---|---|---|---|
| Wave 1 | Smoking | Dead | Not Smoking | |
| Current Smoker | 2835 | 2328 (0.821) | 82 (0.029) | 425 (0.15) |
| Former Smoker | 3855 | 133 (0.034) | 72 (0.019) | 3650 (0.947) |
| Never Smoker | 3771 | 21 (0.006) | 35 (0.009) | 3715 (0.985) |
| Totals | 10461 | 2482 (0.237) | 189 (0.018) | 7790 (0.745) |
Table 2. Wave 2 (1994) to Wave 3 (1996) transition matrix.
| Wave 3 | ||||
|---|---|---|---|---|
| Wave 2 | Smoking | Dead | Not Smoking | |
| Current Smoker | 2482 | 2104 (0.848) | 100 (0.040) | 278 (0.112) |
| Former Smoker | 4075 | 165 (0.040) | 88 (0.022) | 3822 (0.938) |
| Never Smoker | 3715 | 1 (0.000) | 41 (0.011) | 3673 (0.989) |
| Totals | 10272 | 2270 (0.221) | 229 (0.022) | 7773 (0.757) |
Table 3. Wave 3 (1996) to Wave 4 (1998) transition matrix.
| Wave 4 | ||||
|---|---|---|---|---|
| Wave 3 | Smoking | Dead | Not Smoking | |
| Current Smoker | 2270 | 1848 (0.814) | 94 (0.041) | 328 (0.145) |
| Former Smoker | 4100 | 115 (0.028) | 109 (0.027) | 3876 (0.945) |
| Never Smoker | 3673 | 7 (0.002) | 37 (0.010) | 3629 (0.988) |
| Totals | 10043 | 1970 (0.196) | 240 (0.024) | 7833 (0.780) |
Another data table that smokers might be made aware of is one that quantifies the benefits of quitting as a function of how long ago smokers quit. The table also provides a gender breakdown of deaths and shows that there are (mostly unexplained) differences between men and women in rates of smoking-related deaths.
Table 4. Deaths between waves 1 and 4 (1992-1998) by smoking status at wave 1.
| Deaths (%) | ||
|---|---|---|
| Smoking Status | Men | Women |
| Current Smoker | 13.80 | 7.63 |
| Quit <3 years | 11.35 | 12.45b |
| Quit 3-5 years | 7.81a | 6.40 |
| Quit 6-10 years | 5.81a | 4.98 |
| Quit 11-15 years | 7.53a | 3.98b |
| Quit 16+ years | 4.66a | 3.24b |
| Never smoked | 3.49a | 2.85b |
| All | 7.81 | 4.82 |
| N | 401 | 257 |
a Statistically significant difference between group and
Current Smoker group at 0.01 level or better (two-tail test).
b Statistically significant difference between group and Current
Smoker group at 0.05 level or better (two-tail test).
1 Gary Becker's home page: http://home.uchicago.edu/~gbecker/
2 Health and Retirement Study (HRS), University of Michigan Institute for Social Research: http://hrsonline.isr.umich.edu/
DISCUSSION QUESTION:
The use of the term transition matrix suggests that the authors might be thinking of a Markov Chain model. Explain how you would determine such a Markov chain and explain how you would determine if this is a reasonable model.
The
Wisdom
of Crowds :Why the Many Are Smarter Than the Few and How Collective
Shapes Business, Economies, Societies, and Nations.
Doubleday, May 2004, 296 pages,$24.95
James Surowiecki
James Surowiecki is a popular writer and the author of The New Yorker's "Financial Page." This book addresses a an interesting and important statistical question in a way that will fascinate the general public. The issue is: when should we trust our collective wisdom rather than that of an expert? You can get a good idea of the author's answer to this question by reading the excerpts from his book provided here and an excellent review of the book for the New Republic by Cass R. Sunstein, Professor of Jurisprudence and a member of the Department of Political Science and the College of Law at the University of Chicago.
So we will let you read these resources or other reviews on the web for an overview of the book and we will comment on a particular statistical question that arose from reading the book that we think would be interesting to discuss in a statistics class.
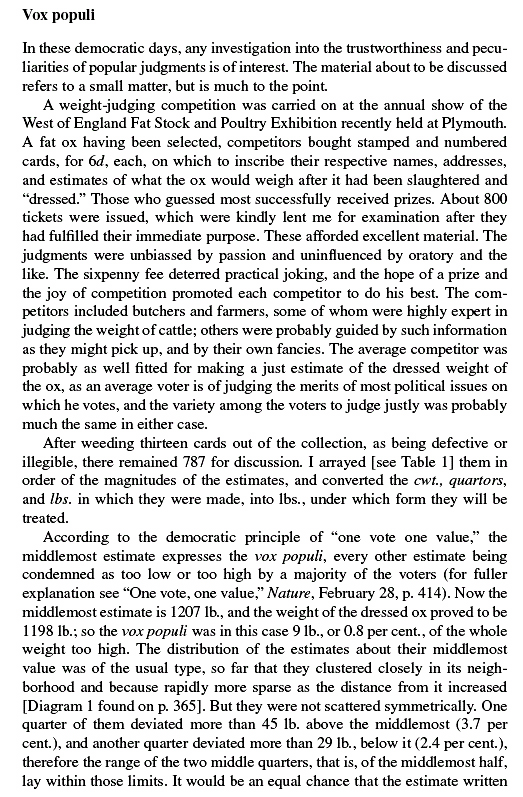
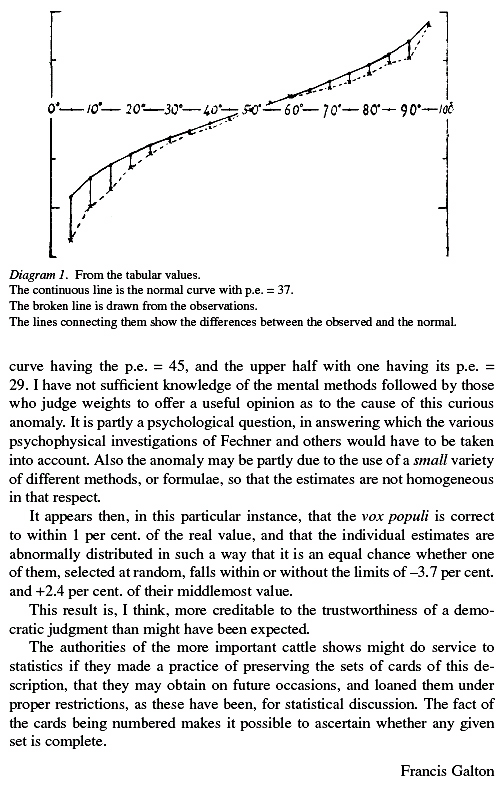
The book starts with a discussion of an experiment of Galton that illustrates the kind of problem addressed in the book. This experiment is discussed in Vox Populi: Nature 75:450-451 and Vox Populi. Nature 75: 450–451. In this paper Galton refers to an earlier related paper : One vote, one value. Nature 75:414. David Levy and Iandra Peart discuss these papers in: "Galton's two papers on voting as robust estimation" (Public Choice 114: 357-365, 2002). In their paper they also include Galton's two papers. In Galton's days papers were short enough that we can also include them here:
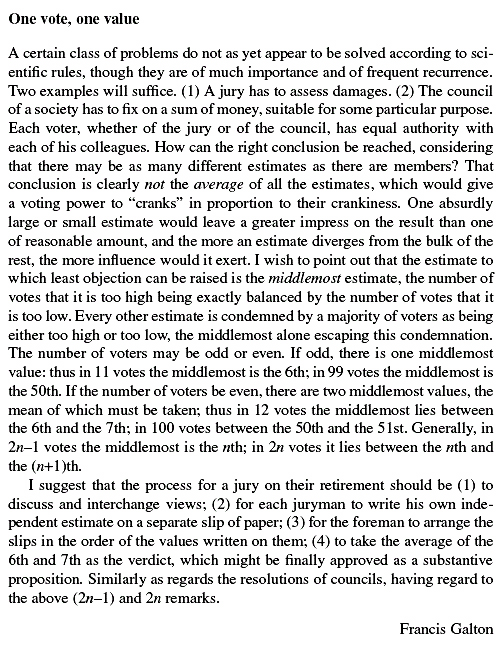
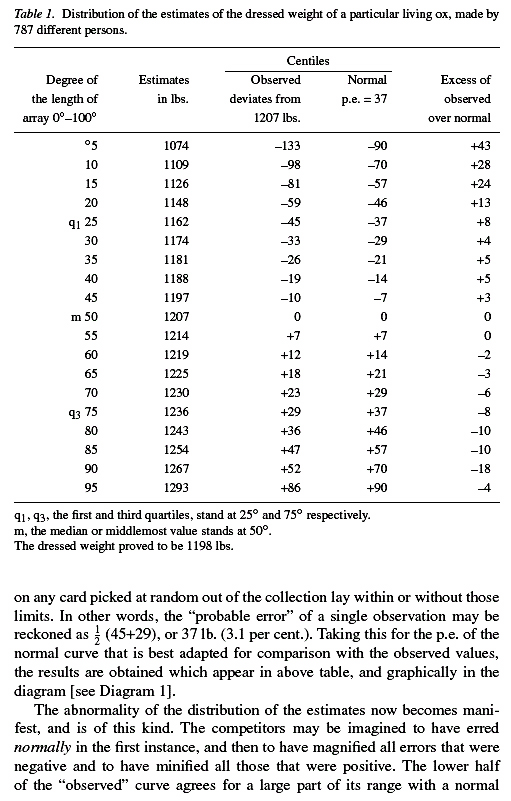
How can the right conclusion be reached, considering
that there may be as many different estimates as there are members? That
conclusion is clearly not the average of all the estimates, which would
give a voting power to “cranks” in proportion to their crankiness.
One absurdly large or small estimate would leave a greater impress on
the result than one
of reasonable amount, and the more an estimate diverges from the bulk
of the rest, the more influence would it exert. I wish to point out that
the estimate to which least objection can be raised is the middlemost
estimate, the number of votes that it is too high being exactly balanced
by the number of votes that it is too low.
However, in discussing Galton's ox example, Surowiecki says that Galton calculated the mean not the median to get an estimate of 1,197 pounds for the true value of 1,198 pounds. In a letter to the editor, 1,197 is an approximation to the mean obtained by averaging the entries in the second column of Galton's Table 1. Even though this gives a better estimate, Galton defends his argument that, in this kind of problem, the median should be used. On the other hand Surowiecki seems to use the average throughout.
The concern of the effect of the "cranks" also occurred to us when we looked at the Jelly Bean Challenge on the book's website . The challenge offers an American Express gift certificate in the amount of one-hundred dollars to the person who best estimates the number of beans in a jar shown from two angles on the website.
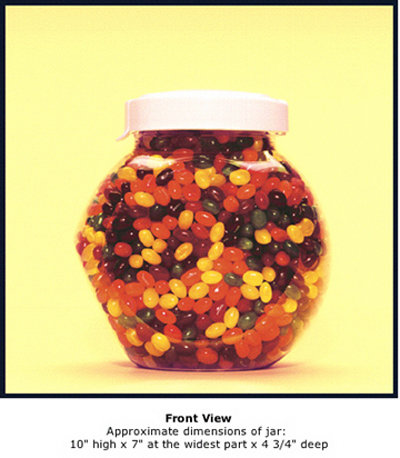
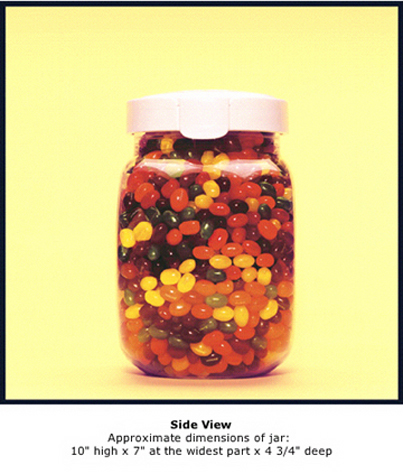
The contest ended August 16 but the winner has not been announced. This kind of contest would make an interesting activity for a statistics class and could lead to a discussion of whether the mean or the median of the estimates gives a better estimate for the true number of Jelly Beans.
DISCUSSION QUESTIONS:
(1) What are the arguments for and against using the median of the predictions as the predictor? What are they for using the mean? Which would you use?
(2) Suppose that people are answering a common question with two possible answers, one false and one true, and that the average probability that each voter will answer correctly exceeds 50 percent. The Condorcet Jury Theorem holds that if each member of the group is answering independently, the probability of a correct answer, by a majority of the group, increases toward certainty as the size of the group increases.
If each person is more likely than not to err, then the theorem's prediction is reversed: the probability of a correct answer, by a majority of the group, decreases toward zero as the size of the group increases.
What does this theorem say about majority opinion as compared to individual opinion? See if you can prove the Condorcet Jury Theorem.
Answer to the "lost boarding pass" puzzle.
First we consider a smaller example:
passenger |
1 |
2 |
3 |
4 |
5 |
6 |
7 |
8 |
9 |
10 |
Assigned seat |
6 |
3 |
8 |
7 |
10 |
4 |
9 |
2 |
5 |
1 |
Final seat |
7 |
3 |
8 |
9 |
10 |
4 |
1 |
2 |
5 |
6 |
Passenger 1 has lost his boarding pass and so randomly chooses a seat. He chooses seat 7 which was assigned to passenger 4. Then passengers 2 and 3 sit in their assigned seats (3,8) and passenger 4 finds his seat taken so randomly chooses a seat from the seats that are free which are the seat of passenger 1 (6) and the assigned seats for passengers behind him in the line (10, 4, 9, 2, 5 1). He chose seat 9 which was assigned to passenger 7. Thus passengers 5 and 6 get their assigned seats (10,4) and 7 must choose a seat randomly from passenger 1's seat (6) and seats assigned to those after him (2,5,1). Passenger 7 chooses seat 1 which was assigned to passenger 10. Now passengers 8 and 9 will get thier assigned seats (9,2) and passenger 10 will have to take passenger 1 seat (6) and everyone has a seat. Had 7 chosen passenger 1's seat then passenger 10 would have his assigned seat. Since passenger 7's choice was a random choice, given that he chose either the seat assigned to the first or last passenger the probability that he chose the seat assigned to passenger 1 is 1/2, so this is the probability that the last passenger gets his assigned seat.
As the above example shows, when the first passenger chooses a random seat, either he chooses the seat assigned to him or the last passenger or he sets in motion a sequence of passengers who find their seats occupied and have to make random choices among the seats available. This sequence continues until a passenger's random choice is either the seat assigned to the first or the last passenger. This must happen before the next-to -last passenger boards since if it does not happen until then, then he would have three seats to choose from: his seat, that of the first passenger, and the last passenger's seat. But that is impossible since he and the last passanger are the only passengers without seats.
Thus one and only one random choice will result in choosing either the first or last passangers seat. Given that this happens there is an equal chance that it is the first or the last person's seat. Thus the probability that the last person gets the seat assigned to him/her is 1/2.
Copyright (c) 2004 Laurie Snell
This work is freely redistributable under the terms of the GNU General
Public License published by the Free
Software Foundation. This work comes with ABSOLUTELY NO WARRANTY.