CHANCE News 13.04
April 18, 2004 to June 7, 2004
Prepared by J. Laurie Snell, Bill Peterson, Jeanne Albert, Charles Grinstead, and Myles McLeod with help from Fuxing Hou and Joan Snell. We are now using a listserv to send out notices that a new Chance News has been posted on the Chance Website. You can sign on or off or change your address at here. This listserv is used only for this posting and not for comments on Chance News. We do appreciate comments and suggestions for new articles. Please send these to jlsnell@dartmouth.edu. Chance News is based on current news articles described briefly in Chance News Lite.
The current and previous issues of Chance News and other materials for teaching a Chance course are available from the Chance web site.
Chance News is distributed under the GNU General Public License (so-called 'copyleft'). See the end of the newsletter for details.
Two tendencies (among others) seem fairly universal among 20th Century humans: a desire to make money as painlessly as possible and excessive willingness to believe that statistics convey valuable information.
Leonard Koppett
Sporting News February 11, 1978
Contents of Chance News 13.04
(1) Forsooth.
(2) Significance: A new journal of the Royal Statistical
Society.
(3) Marilyn vos Savant revises an answer.
(4) A new issue of the Statistics Education Research Journal.
(5) Learning to expect the unexpected.
(6) Ecological Study of the wolves on Isle Royale.
(7) Everybody has a theory about the Yankees' slump.
(8) How do you measure the size of the world economy?
(9) If present trends continue.
(10) Sloppy stats shame science.
(11) The saga of the missing reference.
(12) Are slot machines monsters?
Here is a Forsooth item from the April 2004 issue of RSS News:
From a report on the e-science 'Grid' initiative in UK research councils to help medical researchers use data, computer programs and other resources on the web.
It will support research from start to finish, allowing scientists to ask questions without needing to know what computer processed the data, or where the data came from. It will open up new knowledge-generation capabilities and allow unforeseen applications to emerge.
U.K. Medical Research Council News
Winter 2003
The Royal Statistical Society announced a new journal called Significance that should be of interest to Chance readers.
Significance was launched in2004 is a new quarterly magazine for anyone interested in statistics and the analysis and interpretation of data. Its aim is to communicate and demonstrate in an entertaining and thought-provoking way the practical use of statistics in all walks of life and to show how statistics benefit society. See the Significance website for more details.
In the June RSS News, Chris Chatfield writes "If we are going to criticize others (eg in Forsooth), then it is essential that we get our own house in order." Chris then comments on graphs in the first issue of Significance that do not live up to his standards. He starts with a graph that appeared in an article "Shipman's Statistical Legacy". Dr. Harold Shipman, was one of the most prolific serial killers of all time. It was considered remarkable that one GP could have so many more patients dying than his colleagues without anyone noticing. The authors of this paper explain how industrial quality control techniques could be adapted to signal when death rates among a doctor's patients are surprisingly high. Chris writes:
In the Shipman article, Figure 1 shows a scatter plot of the age and year of death of Shipman's victims. Outside the graph, some red columns appear that I guess are meant to be the histograms of the marginal distributions. However, they don't seem to match up with the plotted data (eg in 1976). I am also puzzled by Figure 2 in which the codes for men and women appear to be the wrong way around. In at least two graphs the axes are not labeled and on page 20, I was unable to understand the plotted line for the land Registry data, which the text says is quarterly, but appears more frequently on the graph.
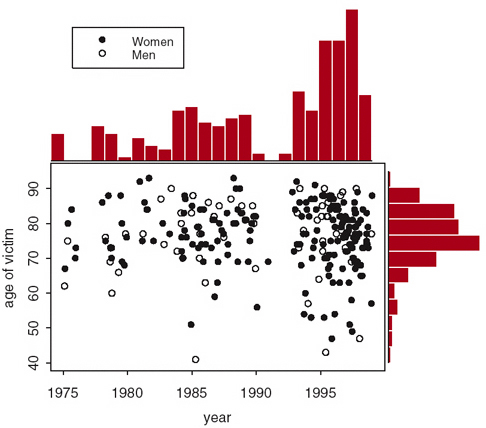
Figure 1. Age and sex of Shipman's victims by date of death
Commenting next on the article "Agricultural data quality" Chris writes:However, the piece de resistance of the whole issue is clearly meant to be the graph showing 'Total Number of Sheep and Lambs in Wales'. This appears in black and white on page 32 and then in glorious colour on the inside back cover. According to the caption, the colours show the number of sheep rather than density. Yet larger areas will clearly contain more sheep. So it seems unfair to colour the upland areas in darker green merely because they are larger. Unless the data are densities? The first colour in the key, namely white, is labeled 'Disclosive', and I wonder how many readers know what this means. Fortunately, the colour does not actually appear on the graph! I was amused to see that the caption gives the plural of sheep as 'sheeps' and green category as the wonderfully precise 178496.

Figure 2. Distribution of sheep in Whales, 2002
Ask Marilyn.
Parade Magazine, 4 April 2004
Marilyn vos Savant
Marilyn issues a correction to her column from May 27, 2001, in which a reader asked:
My husband takes more than 100 flights a year for his job. Although I know that the odds of an accident are the same for every flight, I still think the frequency of the flights should matter. Isn't it at least somewhat more likely that he would be involved in an accident than a person who flies only once or twice a year? I really would like you to agree with me because he maintains that this is not an actual risk for him.In the earlier column, Marilyn had replied as follows:
I agree with both of you. If your husband flies 100 times a year, he runs 100 times the risk of a person who flies only once a year. On the other hand, his risk is still statistically insignificant. Flying is amazingly safe.Marilyn now acknowledges an error in the above, that was recently called to her attention by another reader. She writes:
The sentence should have been phrased this way: "If your husband flies 100 times a year, he runs the risk of a person who flies only once a year 100 times." (The words "100 times" are misplaced.)
DISCUSSION QUESTION:
Do you understand the difference between the two calculations implied here? Dr. Arnold Barnett of MIT calculated that during the 10-year period from 1987-1996, the death risk per flight on established US domestic jet carriers was 1 in 7 million. (reference INFORMS online.) What would the resulting calculations yield?
The May 2004 issue of the Statistics Education Research Journal (SERJ), Vol. 3, No.1, May 2004) is now available. This new issue, as well as archives of older issues and information about the journal, can be found on the SERJ web page . The whole issue can be downloaded as a single PDF (less than 400K), and individual papers can be downloaded separately. Access to issues of SERJ is free. Here is the table of contents for this new issue.
- Editorial.
- New Associate Editors.
- Jose Carmona Marquez. Una Revision de las Evidencias de Fiabilidad y Vadlidez de los Cuestionarios de Actitudes y Ansiedad Hacia la Estadistica.
- Sonia Kafoussi. Can Kindergarten Children be Successfully Involved in Probabilistic Tasks?
- Sue Gordon. Understanding Students' Experiences of Statistics in a Service Course.
- Maria Virginia Lopez, Maria del Carmon Fabrizio, Maria Cristina Plencovich and Hernan Giorgini. Some Issues about the Status of Statistics Teaching in Agricultural Colleges in Argentina.
- Paula R. Williamson and Gillian A. Lancaster. Statistical Education for PhD Students in UK Medical Schools.
- Forthcoming IASE Conferences.
- Other Forthcoming Conferences.
Flavia Jolliffe and Iddo Gal are Co-editors of SERJ.and many other friends are associate editors.
A special November 2004 Issue 3(2), will be devoted to research about "reasoning
on variation".
Dick Kelly suggested the following article.
Learning to expect
the unexpected.
New York Times, 4 April 2004, A29
Nassim Nicholas Taleb
Mr. Taleb is the author of Fooled by Randomness: The Hidden Role of Chance in Life and in the Markets (Thomson Texere, 2001). This opinion article appeared on the day that Condoleeza Rice was scheduled to appear before the 9/11 commission. Mr. Taleb has some general warnings about investigations into past events, which he introduces using the concept of the "black swan", or outlier.
The Bush administration has said that there was no way to anticipate attackers flying airplanes into buildings. In some sense, this is exactly the problem with a black swan. As Taleb writes, "its very unexpectedness helps creates the conditions for it to occur. Had a terrorist attack been a conceivable risk on Sept. 10, 2001, it would likely not have happened". For the same reason, this kind of attack is likely not repeatable. Taleb therefore advises against undue focus on the details of the attack, looking for "precise and narrowly defined accountability".
Taleb observes that we find it much easier to think about known, measurable risks--such as cancer rates--than it is to envision scenarios for unknown future terrorist targets. But the latter are what we now need to be thinking about.
Ecological Studies of Wolves on Isle Royale.
Annual Report 2004-2004
Rolf O. Peterson and John A. Vucetich
This is the annual report of the Wolf-Moose study on Isle Royale National Park where we (Laurie) spent our summers in the 30's and still makes annual visits. This study is the longest predator-prey study every carried out. The Island is closed to the public in the winters but Peterson and his colleagues are allowed to go there in the winter to study the wolves and the moose. Here is a picture of the predator (the wolves) chasing the prey (a moose). This was taken from a short video of the chase which you can view here.

From the report we see that 2003-2004 was a good year for the wolves. They increased from 19 to 29 but a bad year for the Moose. They dropped from 900 to 750. Here is the history of the study since it started in 1958-59 year to 2003-04.
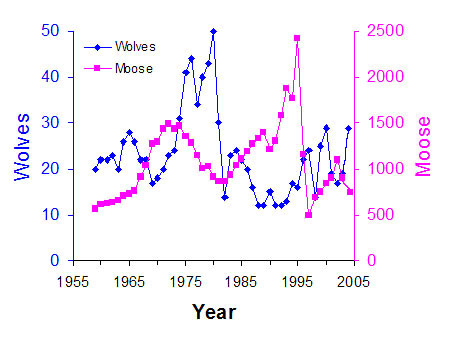
| Wolf and moose fluctuations, Isle Royale National Park, 1959-2004. Moose population estimates during 1959-1993 were based on population reconstruction from recoveries of dead moose,whereas estimates from 1994-2004 were based on aerial surveys. |
Of course there is a large literature on modeling a predator-prey evolution. The most well known model, and the simplest, is the Lotka-Volterra model. However, this model is generally considered to be a first approximation and has been modified to give a more realistic description of the behavior of a predator-prey situation. It has been difficult to find real data to test these models especially for the case of large mammals. The Isle Royale moose-wolf study has provided such data. Two studies using Isle Royale data that we found interesting were a study reported by Montroll et.al in 1973 and a study reported by L.L. Eberhardt in 1998. Both of these studies involve modification of the Lotka-Volterra model. Here are graphs from Eberhardt's study showing the fit for the wolves and the moose up to 1996.
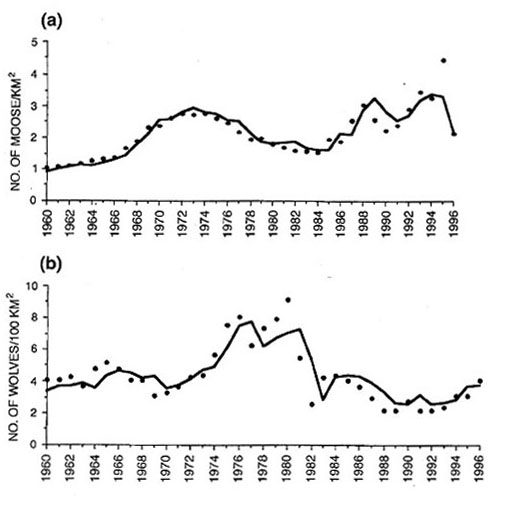
Of course data from the period studied was used to determine the parameters of the model, so it would be interesting to see how these models describe later data. You can find this data here (it can easily be copied and pasted into an Excel document).
You will find an excellent educational video on the wolf-moose study at the The Wolves & Moose of Isle Royale website.
DISCUSSION QUESTIONS:
(1) When the number of wolves dropped to 12 in 1996, Rolf Peterson
gave a talk at Isle Royale on the future of the wolves on the Isle Royale. In
particular he discussed the question: If the wolves die out, should the Park
Service bring new wolves to the Island. Do you think they should?
Editors' comment. In his talk Rolf said that, even if the wolves did die out,
it would probably not happen for the next ten years at least. I asked Rolf if
he felt obligated to see it to the very end. He replied "I would consider
it a privilege". (How to people think of such nice answers?)
Everyone
has a theory about the Yankees' slump.
The New York Times, 8, p. 11, 2 May, 2004
Alan Schwarz
This article discusses the recent New York Yankees' slump. Schwarz consulted well known sports statisticians and writes:
Carl Morris, a professor of statistics at Harvard and the author
of several papers applying sophisticated analysis to batting averages, determined
that only unfathomably bad luck could account for the Yankees' hitting this
poorly. If one assumes for the moment that the regular lineup's batting average
should be about .280 — roughly the composite career averages of its players
— its getting just 164 hits over 720 times at bat, as the real-life Yankees
had done through Thursday, was virtually impossible to happen randomly.
"The standard deviation after 720 team at-bats should be
about 16 points," Morris wrote in an e-mail message, "so even if we
give them two full standard deviations of bad luck, they're only at .260. The
chance of a .280 hitter batting .228 after that long is about 1 chance in 1,200,
so something additional would have to be going on."
Albert, a professor of mathematics and statistics at Bowling Green and co-author
of "Curve Ball: Baseball, Statistics, and the Role of Chance in the Game,"
is particularly fascinated by models of slumps and streaks. Examining data from
this season's Yankees, Albert's computer analysis determined that it was incredibly
unlikely for the Yankees to have had a constant probability of getting a hit
each time they strode to the plate; it must have decreased when the batter behind
them made an out, helping to prolong the entire team's malaise.
"There's a clustering that gives credence to the 'feast or famine' that
players talk about," Albert said.
Our colleague Charles Grinstead just finished his own analysis of streaks in baseball, pouring over the results of the batting performances of hundreds of baseball players. We asked him to comment on the Yankees' apparent slump. Charles wrote:
Streaks in sports exist, but then if one flips a coin many
times, there will be streaks in the sequence of outcomes. The question of interest
here is not whether baseball players (or basketball players, or bowlers) are
streaky, but how well the observed outcomes in sports are fit by the simple
Bernoulli trials model.
As pointed out in the article, many people, including serious scientists, have
worked on this problem. Complicated models have been proposed to explain players'
hot and cold streaks. It is almost always the case that if one carefully crafts
a model to fit data, the fit will be better than the corresponding fit of a
simple model. Nevertheless, if the simple model fits the data fairly well, then
one should at least admit this before moving to more complicated ones.
The Bernoulli trials model suffers when used in sports for at least two reasons.
First, it is clear that the model does not take into account many factors that
affect the results. For example, if Roger Clemens is pitching, then the probability
that a given batter gets a hit against him is probably lower than his season
average. (Roger Clemens is 6-0 this season, and the combined batting average
of the players who have faced him is .193, which is far below the league average.)
Second, fans and players believe in streaks, and generally know little or nothing
about the Bernoulli trials model. When a player gets 5 hits in a row, say, he
is said to be 'hot,' and most people, including the player, thinks that he is
very likely to get a hit his next time up. This situation continues until it
doesn't, at which point he has 'cooled off.' Many fans have also played sports,
and have been in situations where they have felt that they were 'hot,' or 'in
the zone.' This feeling is due to their recent successes, and once again it
continues until it doesn't; in other words, it's not easy to say in advance
when one will 'cool off.'
Of course, if one flips a coin, one could say at some points that the coin is
'hot,' because a large number of consecutive heads has occurred, but fairly
quickly after this, the coin will 'cool off.' But of course, no one says that
coins can get hot. An interesting middle ground occurs at the casinos. Even
though slot machines (or blackjack games) are random events, players who win
a high percentage of tries over a short period of time are said to be 'hot.'
What should a statistician, or any other type of scientist for that matter,
do? One idea would be to analyze the data, and see just how well the Bernoulli
trials model fits it. This has been done by many people, including the editors
of Chance News. It is possible that sometime in the not-too-distant future,
a book will appear, called The Best of Chance, or Fat Chance, or something like
that, in which there will be a chapter devoted to streaks in sports and in the
stock market. It is possible that such a chapter has already been written.
Here is an example of what appears in that chapter (if, in fact, it exists).
Many people have waxed poetic about Joe DiMaggio's 56-game hitting streak. This
accomplishment consisted of a set of 56 consecutive games in the 1941 season
in which DiMaggio got at least one hit in each game. It has been called the
most amazing event that has ever occurred in professional sports, and many people
have calculated how improbable it was.
Unfortunately, most people don't ask the right question when discussing this
streak. The usual question runs something like this: Suppose a player has a
batting average of .357. Suppose, in addition, that he gets four at-bats in
each game (DiMaggio's average number of at-bats per game during the streak was
3.98.) What is the probability that he gets at least one hit in each game (in
the Bernoulli trials model)?
The answer is very easy to compute; it is approximately .0000276. If one admits
that there will be some games in which the player will get to bat fewer than
four times, and some where he'll get more than four at-bats, then this estimate
gets smaller.
We feel, however, that the correct question to ask is the following one: Assume
that we have one coin for each player-season in major league history, and the
coins have heads probabilities equal to the player's batting average in the
corresponding season. What is the probability that, if the coins are used to
simulate the players' seasons, that we would observe at least one hitting streak
of at least 56 games in length?
The answer in this case is much more difficult to compute. We simulated all
player-seasons in which the player's batting average was at least .340 (thereby
eliminating most players and lowering our estimate) and recorded the longest
hitting streak that we saw. We repeated this 1000 times. Variations in the number
of at-bats in different games were taken into account.
In the 1000 iterations of this simulation, the length of the longest observed
hitting streak ranged from 33 to 85 games, and in 126 iterations, or about 1
in 8, the longest streak was at least 56 games in length. Another way to put
this is if there were 8 parallel universes in which the baseball players had
identical abilities, then the Bernoulli trials model would say that it would
not be all surprising to observe at least one hitting streak of at least 56
games.
Returning to the Yankees, their shortstop, Derek Jeter, suffered through a set
of 32 consecutive at-bats without a hit. It was calculated that if a player
has a .317 batting average, the probability that he has a hitless streak of
32 at-bats in a set of 91 at-bats (the number of Jeter's at-bats through a certain
point this season) is 1 in 7200, or about .00014. In fact, we calculate the
probability that the longest hitless streak is exactly 32 at-bats to be .0000325,
and the probability that the longest hitless streak is at least 32 at-bats to
be .000099, but we won't quibble.
Once again, a better question to ask might be: What is the probability that
someone of Jeter's ability will have at least one hitless streak of at least
32 at bats in his career? But why pick on Jeter? One might even broaden this
to ask of all of the hitters whose career batting average exceeded .300, say,
what percentage of them would we expect, under the Bernoulli model, to have
had at least one hitless streak of at least 32 at-bats?
While the answer to this last question can be estimated, it's not much fun to
do so, since we don't have actual statistics on the longest hitless streaks
by major league players. In Jeter's case, he has had 4981 career at-bats, and
as stated above, his career batting average (at the beginning of this season)
was .317. The probability that someone of this caliber and this career length
would have at least one hitless streak of at least 32 at-bats is about .006.
So, although it is very unlikely that any given player of Jeter's ability will
have as long a hitless streak as he suffered through, it is easy to see that
since there have been so many .317 or better career hitters (68, according to
one source), it's not at all unlikely that at least one of them had a hitless
streak of at least 32 at-bats.
Next we have a series of articles from The Economist suggested by John Gavin.
Measuring
economics: Garbage in, garbage out; measuring economics.
The Economist, 29 May 2004
Food
for thought.
The Economist, 27 May 2004
These articles ask: how do we determine the size of the world economy? Adding
up the size of all of the world's economies can be done in different ways leading
to materially different answers. One approach is to use current market exchange
rates to convert each country's national economic output into US dollars and
sum these.
An alternative approach is to take account of differences in prices of the same
goods between countries. This is achieved by defining a new exchange rate called
purchasing power parity (PPP), to measure the real purchasing power of inhabitants
in each country, irrespective of how the world's currency markets happen to
be fluctuating at the time.
The first article discusses advantages and disadvantages of these two methods.
The second article says that in 1996 The Economists suggested a hightly simplified method for estimating the PPP based only onthe price of a McDonalds' Big Mac in each country. You can buy a Big Mac in 120 different countries. In the second article they provide the current Big Mac PPP.
Here is how the Big Mac PPP is computed. Consider, for example, Japan. At the time this article was written the price of a Big Mac in the U.S. was $2.90 and in Japan 262 yen. Thus to make the values the same we would define the exchange rate so that $1 = 262/PPP= 2.90 . Thus the Mac PPP for Japan is 262/2.90 or 90.34.
The last column in the chart is the Over/Under valuation against the dollar the chart calculated by:
((PPP-Exchange Rate)/Exchange Rate)100
The current exchange rate for Japan is 111.27 so, for Japan, the Over/Under valuation is:
((90.34 - 111.27)/111.27 )100= -18.81
Note that The Economist got -20 but the exchange rate was probably different when the article was written.
Thus we can make money buying Big Macs in the U.S. and selling them in any country for which over/under valuations is negative. Note that this is true of almost all countries.The Swiss franc is the most overvalued currency (+69) and the Philippine peso is the most undervalued currency (-57).To show the difference between measuring global income by market rates and by PPP the first article remarks:
Measured at market rates, developing economies'
share of global income has fallen over the past two decades, to less than a
quarter. Measures at PPP, developing economies' share of world income has risen
over the same period, to almost half of the total.

If present trends continue.
The Economist, 27 May, 2004
The author uses the example of obesity to illustrate the problem of interpolating to the future. We read:
The temptation is to shout very loudly; and it is one that the
House of Commons Health Select Committee has not tried to resist in the report
on obesity it published this week. “The devastating consequences of the
epidemic of obesity are likely to have a profound impact over the next century.
Obesity will soon supersede tobacco as the greatest cause of premature death
in this country. It is staggering to realize that on present trends half of
all children in England in 2020 could be obese,” says the committee's
chairman, David Hinchliffe.
Indeed they could; but on present trends, the oil price could be $80 a barrel
before the end of next year. Only we know it will not be, just as we know that
Britons will not, in fact, go on getting fatter until they pop. The only certainty
about present trends is that they won't last, and doom-mongers serve their cause
badly by drawing straight lines on graphs assuming that they will.
Sloppy
stats
shame science.
The Economist, 3 June, 2004
Incongruence
between test statistics and P values medical papers.
BMC Medical Research Methodology,
2004, 4:13
Emil Garcia-Berthou and Carles Alcaraz
In their article, Garcia-Berthou and Carles Alcaraz investigated 32 papers from editions of Nature published in 2001, and 12 papers from the British Medical Journal in the same year. The authors checked the calculations of the p values. They also looked at the distribution of the digits of numbers used in the tests. They found that 38% of those sampled from Nature, and 25% of those sampled in the British Medical Journal contained one or more statistical errors. The authors concluded that 4% of the errors may have caused non-signficant findings to be misrepresented as being significant.
As the article suggests, these errors would be more likely to be noticed by the reviewers and others if authors were required to make the raw data available. Maxine Clarke, publishing executive editor of Nature remarked :
We do not explicitly ask authors, as routine, for the raw data underlying their reported statistical results. This suggestion is now on the agenda for our next editorial meeting on editorial practices and criteria.
Kamran Abbasi, deputy editor of the British Medical Journal said:
We certainly do not spend our time recalculating all these numbers, and our whole review process would likely grind to a halt if we tried to do so.
The BMC Medical Research Methodology journal is an "open source" journal.
DISCUSSION QUESTION:
(1) Do you think that journals should require their authors to provide the raw data for their study?
(2) The Dartmouth Committee for the Protection of Human Subjects requires that, before a study involving humans is carried out, the authors must submit a proposal which provides, among other things, an explanation of the study procedures and data collection and analysis process. Would this information be useful in evaluating the results of the study? If so, why?
Carrying
Statistics to Extremes.
Sports Illustrated, 11 February 1978
Leonard Koppett
Every year before the super bowl football game we are reminded of Sports Writer Leonard Koppett's claim that the winner of the super bowl game is a good predictor as to how the market will go in the following year. Here is an excerpt from are article "Would Panther's Win Boost the Bull?" by Frank Slusser in Business Week Online January 26,2004.
With the stock market regaining momentum after a brutal downturn,
should investors root for the National Football Conference champion Carolina
Panthers to maul the New England Patriots, the American Football Conference
titleholder, in Super Bowl XXXVIII on Feb. 1 in Houston? Yes, according to the
Super Bowl Theory, a fanciful equity-market predictor.
Invented by the late New York Times sportswriter Leonard Koppett, the
theory combines two consuming American passions -- the stock market and football.
The theory, which holds up 81% of the time (30 out of 37 years) when applied
since Super Bowl I, says if the NFC team -- or an AFC team that was a member
of the premerger National Football League -- wins the game, the stock market,
as measured by the S&P 500-stock index, will rise for the entire year. Conversely,
if the AFC team wins, the market will go down in that year.
We became interested in this predictor when Alex Dinn, a student in the Dartmouth Chance course, gave a statistical analysis of this predictor for his final project.
The first thing we discovered was that not only had this been the subject of a large number of news articles, it had also been the subject of at least three scholarly papers:
Did Joe Montana Save the Stock Market?, Edward A. Dyl,
John D. Schatzberg, Financial Analysts Journal, September-October 1989.
What is Up With the Super Bowl Phenomenon?--A Study, Charles Rayhorn
and Harry Guenther, Personal Financial Planning, January/February 2000
Permuting Super Bowl Theory, Patrick Burns, January 2004, Working paper, Burns Statistics website.
Reading these and other news articles we were struck by the fact that, in every article including articles by Koppett, it is said that Koppett put forth his predictor in an article in the New York Times in 1978. No one gave the day the article appeared. Neither we nor Dartmouth's finest reference librarians were able to find such an article. We offered a $100 reward for the first person to find it.
In the process of looking for the article we learned that Koppett was a famous and beloved Sports writer. He died June 22, 2003 at age 79 (while attending a concert). Memorial commentators emphasized his love of music, in particular opera, and his wonderful sense of humor. They also said that Koppett was the first sports writer to use serious statistics beyond the box-score. Koppett was inducted into the writer's wing of the Baseball Hall of Fame in 1992.
Koppett came to America from Russia when he was about 5 years old. He was brought
up in New York and graduated from Columbia College in 1946 after serving in
the Army.
Koppett worked for The New York Herald Tribune from 1948 to 1954, The
New York Post from 1954 to 1963 and the New York Times from
1963 to 1978. He was later sports editor and editor in chief at The Peninsula
Times Tribune of Palo Alto, wrote a column for The Sporting News
and The Oakland Tribune, and wrote a weekly column for The Seattle
Post-Intelligencer at the time of his death.
Noting that he wrote a column for the Sporting News we decided as a last resort to look there. We found there, in his February 11,1978 weekly column, what we now believe is the missing article. This article has no reference to an earlier article. However our 100$ reward still stands for first person who can show that the missing article is really in the 1978 New York Times. Here is the part of the Sporting News column where we believe Koppett first discusses his predictor. The complete column is available here.
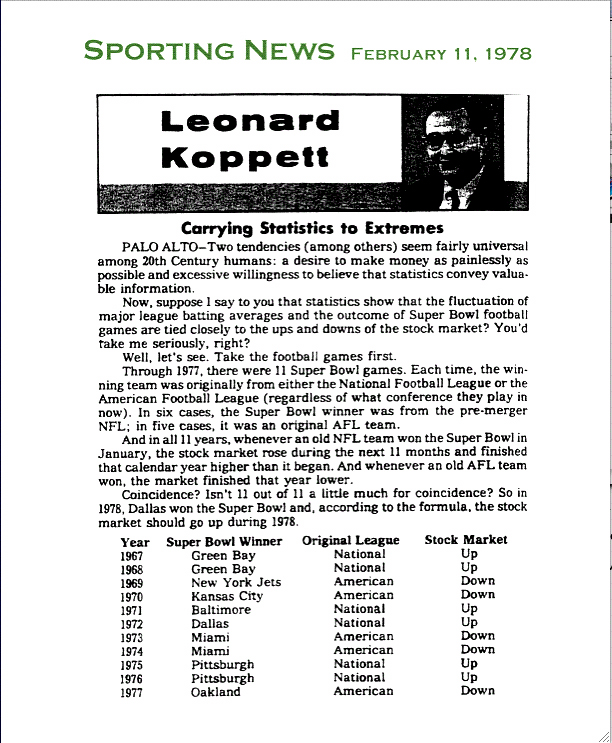
The article goes on to describe a similar prediction for baseball noting that in 12 of the last 15 years when the aggregate major league batting average goes up, the stock market goes down, and vice-versa. He concludes his article with following remarks:
What does all this mean? Absolutely nothing on any rational level-and that's exactly the point. Just because two sets of numbers coincide in some way, don't leap to the conclusion that one set "causes" the other. To use sports statistics constructively, you must never lose sight of that possible error. Some sets of numbers do prove something, others don't prove but suggest and others create misleading similarities. Statistics, always, are the starting point of an investigation, not the conclusion.
There is no reference to a previous article in this article.
While we were searching for the original article we wrote to Koppett's son David who sent us sent us three articles written by his father in recent years dealing with his predictor. One of these appeared in the The Seattle Post-Intelligencer . His weekly column for this newspaper was called The Thinking Fan. All of his columns from October14, 1999 until June 20, 2003 are freely available from the Post-Inelligencer's website (just search for Koppett). A number of these columns deal with statistical issues.
One of the articles that David sent us was apparently written in 2000 but reconsidered for publication in 2003. This article seems to us to best describes Koppett's feelings about his predictor so we include it here:
SUPER BOWL STOCKS.
By Leonard Koppett (Needs 2001—2002 update)
As the discoverer and chief chronicler of the Super Bowl
Stock Theory (SBST), which had proved 95 percent reliable for more than 30 years,
I am happy to announce its formal demise, may it rest in peace. One again, we
have seen a beautiful theory brutally murdered by uncaring facts.
From 1967, when the first Super Bowl was played, through 1997, the SBST held
true. If one of a certain group of teams won the Super Bowl Game each January,
the stock market finished that calendar year higher than the previous Dec. 31.
If not, it finished lower. It missed only once, under special circumstances,
in 1990.
Now, for the third straight year, without special circumstances of any kind,
it has failed, spectacularly so. The football results had indicated a lower
close in 1998 and 1999. Instead the market soared to all-time highs. And in
2000, when an “up” team won, it finished lower.
Why is this good news? Because there was no conceivable reason for any such
correlation, and its persistence became an embarrassment to rational thought.
At a time when the acceptance of irrationality was increasing alarmingly on
all fronts, we didn't need so vivid an example of apparent corroboration of
arcane forces.
What’s more, the formula couldn't’ make you money. It didn't tell
you who would win the next game; all it guaranteed was a one-cent increase or
infinite loss in the stock index days later. So who needs it?
Its exact formulation worked this way: In 1966, the National Football League
and the American Football League agreed to merge, making possible a Super Bowl
Game between the two league champions. When it realigned as a unified league
in 1970, three of the NFL teams joined the 10 AFL teams in an “American
Conference”. The others formed a “National Conference”. Now
the two Super Bowl contestants became the champions of the two13-team conferences.
It turned out that if the Super Bowl winner were a team originally in the NFL
(in 1966), the market would go up. If it were a former AFL team, the market
would go down, comparing simply one Dec. 31 to the next.
I uncovered this pattern in 1978, in the sports pages of the New York Times.
Using only the New York Stock Exchange Index, it was then 11 for 11. When that
failed to hold in 1984, I did what any good statistician does: I broadened my
statistical base until I got the numbers I wanted.
Henceforth, the theory could be considered “correct” in either of
two ways.
1. Using the Dow Jones Industrial Average, the Standard and Poor 500 and the
NYSE Index, one could count only those years (most of them) when all three moved
in the same direction, ignoring the years they split.
2. One could count every year and mark it “correct” if at least
one of the three pointed the right way,
Until 1998, the first way held up 24 times out of 25, or 96 percent. The second
way held up 30 times out of 31, or 97 percent. Few stock analysts can boast
such records.
But the last two Super Bowl were won by the Denver Broncos, an original AFL
team, so stocks should have gone down. Instead, the Dow jumped from about 7,900
to 9,200 in 1998 and to 11,000 or so in 1999, and the other two followed suit.
(When the Green Bay Packers, an “up” team, won the first Super Bowl
in 1967, the Dow leaped from 786 to 905).
So either Denver’s victories or the theory had to be wrong. Since there
is no way to undo two Super Bowl results, being unanimously wrong two years
in a row is reason enough to discard any theory that flirts with perfection.
And sure enough, the market went down when an “up” team won ---
the St. Louis Rams, an NFL member since the 1930s by way of Cleveland and Los
Angeles.
The one previous miss, in 1990, was an accident of timing.
That January, the San Francisco 49ers, a pre-merger NFL team, won. That should
have dutifully sent the market higher, and sure enough, by November, the indexes
were well ahead of 1989.
But the possibility of war in Iraq, with a major military build-up already under
way, shook up investors. With uncertainty at its height on Dec. 31, all three
indexes had sunk a bit lower than the year before. However, in the first couple
of months of 1991 the war turned out to be short and successful, and the market
bounced back up to the levels it should have stayed at all along, and kept rising.
After the New York Giants won the 1991 Super Bowl, the market closed out the
year up 20 percent.
So either Denver had no right two win the last two Super Bowl games, or the
theory is kaput. Good riddance. At last.
Can it be resurrected? Hardly. The 2001 winner was the Baltimore Ravens, whose
lineage is hard to pin down. They came into existence in 1996 when Art Modell
moved the Cleveland Browns' franchise to Baltimore, agreeing to leave the name
“Cleveland Browns” for use by an expansion team that would eventually
be placed there (and was). So are the Ravens “really” the continuation
of the Browns, or the first expansion team (after 1970) to win a Super Bowl?
If the Ravens are an expansion team (like Tampa Bay, Seattle, Carolina and Jacksonville),
they are the first such to test the stock theory, which has no hard and fast
provision for teams younger than the theory itself. The Ravens are in the American
Conference, but didn't come from either the American or National Football League.
How does that make them either an up or a down signal?
But if the Ravens are actually the old Cleveland Browns franchise that switched
conferences in 1970 for the sake of the merger, they should clearly by an “up”
signal, as were the Steelers and Colts in the years they won. And the chances
of 2001 finishing higher than 2000 don’t look good. That would make four
misses in a row.
So it’s dead. Dead as a doornail. What a relief.
In an article "Super Bowl Stock Theory Making a Comeback? submitted Jan 29, 2003, Koppett makes his final update and, to his dismay, fears that his theory may not be dead after all. He ends this article with:
That allows us to cling to the hope that the inexplicable
can remain undecipherable in a possibly rational universe. # # # #
Leonard Koppett first brought the SBST to light in The New York Times
in January, 1978, and says he still carries the burden of guilt.
Kopett's last remark will be a great help to those who want to try to win the $100 prize.
You can read the full article here. The third article that David sent us as well as Koppett's January 24, 2003 column "Raiders...and why you can take it to the bank" in the Post-Intellenger deals with generalizations of his predictor.
While it is clear that Koppett considered his theory as a joke, it is a wonderful example of how easy it is to establish significance when you do not make available your hypothesis and how you plan to test it before the carrying out the experiment.
Of course it is still interesting to look at the data for Koppett's predictor.
Here is the data from Alex Dinn's project;
Year |
NFL Wins Super Bowl |
Dow Increases |
NYSE Increases |
S&P Increases |
SMI Right (Based on Dow) |
SMI Right (Koppett's) |
1967 |
1 |
1 |
1 |
1 |
1 |
1 |
1968 |
1 |
1 |
1 |
1 |
1 |
1 |
1969 |
0 |
0 |
0 |
0 |
1 |
1 |
1970 |
0 |
1 |
1 |
1 |
0 |
0 |
1971 |
1 |
1 |
1 |
1 |
1 |
1 |
1972 |
1 |
1 |
1 |
1 |
1 |
1 |
1973 |
0 |
0 |
0 |
0 |
1 |
1 |
1974 |
0 |
0 |
0 |
0 |
1 |
1 |
1975 |
1 |
1 |
1 |
1 |
1 |
1 |
1976 |
1 |
1 |
1 |
1 |
1 |
1 |
1977 |
0 |
0 |
0 |
0 |
1 |
1 |
1978 |
1 |
0 |
1 |
1 |
0 |
1 |
1979 |
1 |
1 |
1 |
1 |
1 |
1 |
1980 |
1 |
1 |
1 |
1 |
1 |
1 |
1981 |
0 |
0 |
0 |
0 |
1 |
1 |
1982 |
1 |
1 |
1 |
1 |
1 |
1 |
1983 |
1 |
1 |
1 |
1 |
1 |
1 |
1984 |
0 |
0 |
1 |
1 |
1 |
0 |
1985 |
1 |
1 |
1 |
1 |
1 |
1 |
1986 |
1 |
1 |
1 |
1 |
1 |
1 |
1987 |
1 |
1 |
0 |
1 |
1 |
1 |
1988 |
1 |
1 |
1 |
1 |
1 |
1 |
1989 |
1 |
1 |
1 |
1 |
1 |
1 |
1990 |
1 |
0 |
0 |
0 |
0 |
0 |
1991 |
1 |
1 |
1 |
1 |
1 |
1 |
1992 |
1 |
1 |
1 |
1 |
1 |
1 |
1993 |
1 |
1 |
1 |
1 |
1 |
1 |
1994 |
1 |
1 |
0 |
1 |
1 |
1 |
1995 |
1 |
1 |
1 |
1 |
1 |
1 |
1996 |
1 |
1 |
1 |
1 |
1 |
1 |
1997 |
1 |
1 |
1 |
1 |
1 |
1 |
1998 |
0 |
1 |
1 |
1 |
0 |
0 |
1999 |
0 |
1 |
1 |
1 |
0 |
0 |
2000 |
1 |
0 |
1 |
0 |
0 |
0 |
2001 |
1 |
0 |
0 |
0 |
0 |
0 |
2002 |
0 |
0 |
0 |
0 |
1 |
1 |
2003 |
1 |
1 |
1 |
1 |
1 |
1 |
Average |
0.72973 |
0.7027 |
0.72973 |
0.7568 |
0.810811 |
0.810811 |
We see from this that it appears that Koppett made a mistake in saying that the first 11 years were all successful. We see that in 1970 an AFL team won but all three of the market indices went up.
In analyzing this data, Alex writes:
The likelihood of the NFC winning is 0.73 and the
likelihood of the Dow rising in a given year is 0.70; therefore, the indicator
will be correct approximately 59.3% of the time. This calculation is based on
two possibilities for success; an NFC team wins and the Dow increases, or an
AFC team wins and the Dow declines. Since an NFC team wins 73% of the time and
the Dow goes up 70% of the time, the probability that both events occur is the
product of the two (0.73*0.70), assuming the two events are independent. Similarly,
the probability that both events do not occur is the product of the probability
that each event does not occur ((1-0.73)*(1-0.70)). Adding the two possibilities
together ((0.73*0.70) + ((1-0.73)*(1-0.70))) gives the expected success rate
of 59.3%.
The 37 predictions based on the Dow were correct 30 times. The probability of
getting 30 or more success for Bernoulli trials with probability .593 for success
is .0043 so this result is significant at the 5% confidence level.
Alex observes that with only 37 data points the margin of error for the estimates for the probability that the NFC wins and for the probability that the Dow rises is about 15%. Thus an estimate of .8 for these probabilities would not be unreasonable. In this case the results are no longer significant.
Some also would say that we really should not count the years before the prediction was made. If we do we make 25 predictions with 20 correct based on the Dow. Our estimate for the probability that we are right becomes .656 and the probability of getting 20 or more correct is .092 so the results are not significant at the 5% confidence level.
In discussing Koppett's predictor in Peter Doyle's probability course, it was suggested that it might be better to use the entire year's stock prices rather than just at the end points of the year to decide if the market when up or down in the year following the Super Bowl game. Kailin Kroetz did this by fitting the best fit line to the Dow stock market values from the day after the super bowl game to the day before the next super bowl. If the slope of this line is positive she says the market went up and if it is negative she said that it went down. Here are her graphs for the first four years of the Super Bowl.
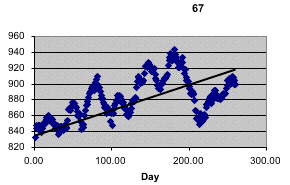 |
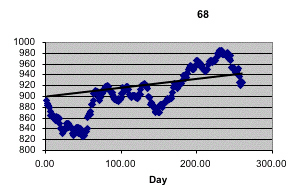 |
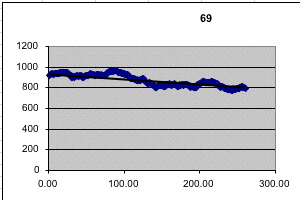 |
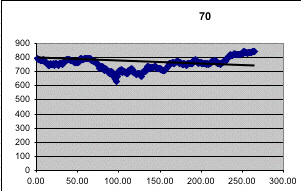 |
Recall that 1970 was the year that Koppett apparently got it wrong since an AFC team won but all the indices went up. But according to this criteria he was right since the best fit line for 1970 went down! This method also gives the correct prediction in 1878. In fact this method produced a streak of 27 correct predictions from 1967 to 1993! Kailin did the same analysis using the New York Stock exchange which gave only 5 incorrect predictions but one of these was 1990 so the longest streak of correction predictions was only 23.
So, as with many statistical studies, if we can choose our method for establishing significance we can show significance if we want to and also show that it is not significant if that is our aim.
The
tug of
the newfangled slot machines.
New York Times, Magazine Desk, 9 May 2004, p 42
Gary Rivlin
This is a wonderful article on the current state of slot machines. It concentrates on machines made by the International Gaming Technology (IGT), the country's largest maker of slot machines. It has extensive interviews with Anthony Baerlocher, a mathematician with the job of chief game designer for IGT, and Joe Kaminkow who is the head of the design and product-development division of IGT.
Early in the article we learn what a big deal slot machines have become in modern life.
Nearly 40 million Americans played a slot machine in 2003, according to an annual survey of casino gambling conducted by Harrah's Entertainment. Every day in the United States, slot machines take in, on average, more than $1 billion in wagers. Most of that money will be paid back to players, but so great is the ''hold'' from slot machines that collectively the games gross more annually than McDonald's, Wendy's, Burger King and Starbucks combined. All told, North American casinos took in $30 billion from slots in 2003 -- an amount that dwarfs the $9 billion in tickets sold in North American movie theaters that year. Pornography, the country's second most lucrative form of adult entertainment, doesn't come close, either: experts estimate that Americans spend at most $10 billion a year on live sex shows, phone sex and porn in various media from cable to DVD to video and the Internet.
The article goes on to describe how modern technology of video, sound, and clever programming makes slot machines much more attractive to the player. This involves including million dollar jackpots, giving the player some reward frequently, having the reels stop frequently close to a large winning combination. Experts in addictive behavior are quoted as saying, in effect, slot machine designers know all the tricks.
As recently as 1972 a slot machine, or one armed bandit, looked something like this:
You put in a nickel, pulled the arm, and the three wheels spun around. The wheels stopped showing a configuration of fruits some of which sent some nickels clinking back to you. For example, if this machine stopped on the line" cherry, cherry, lime" you might get a couple of nickels. If it stopped on three cherries you might hear a number of nickels falling into the payoff tray.
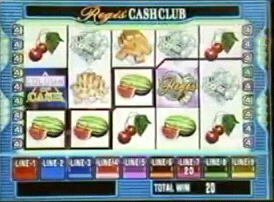
Here is what a modern slot machine looks like:
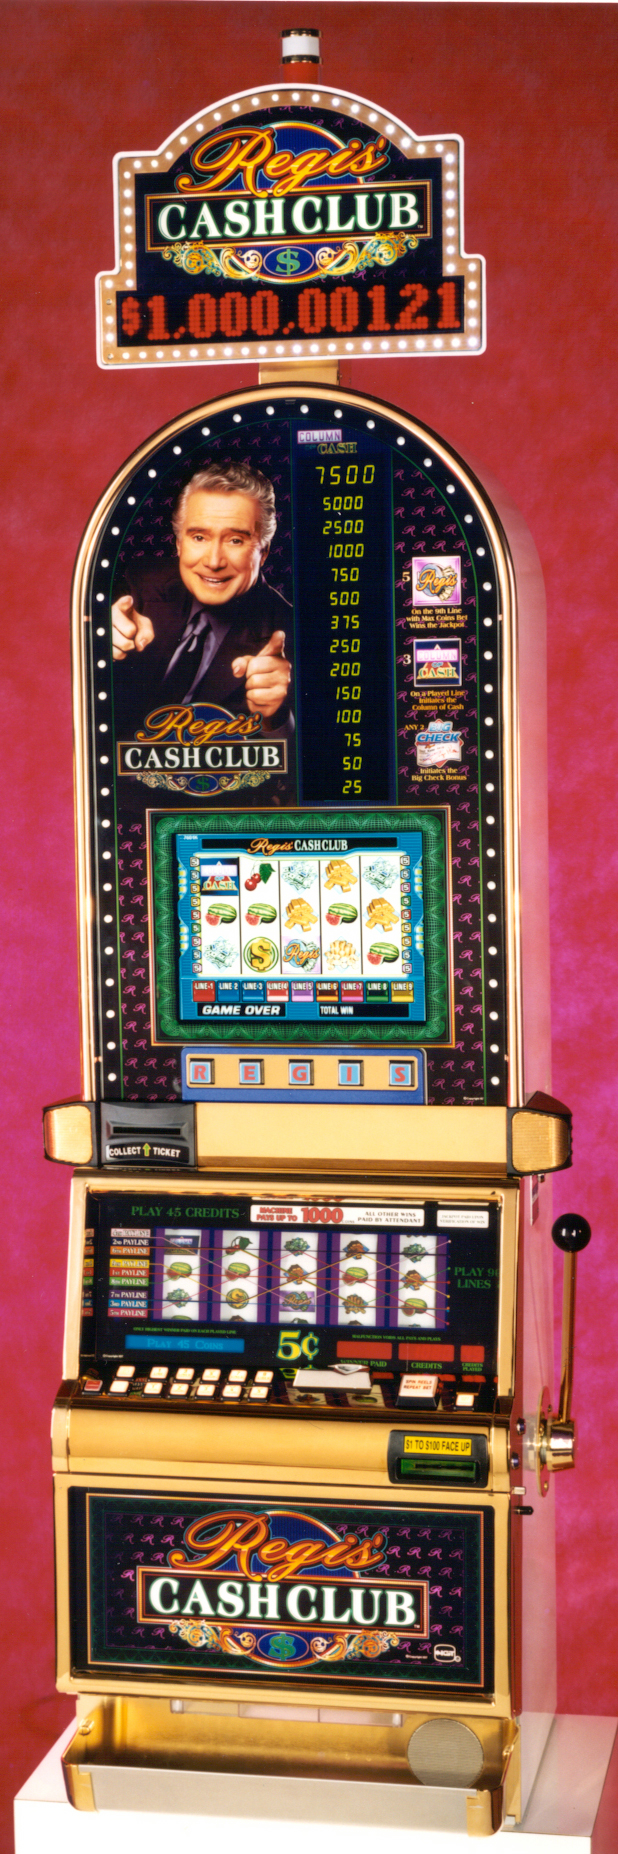
This is an example of a "reel slot machine." This means that there are mechanical reels that really spin. But where the reels stop is determined by a computer. Machines for which even the reels are electronic are called "Video slot machines.
This machine looks like a monster! You can watch a video of how it works here. If you want to understand how it works you should certainly start by watching the video. However, we still had a number of questions still when we watched it, so, with the help of Connie fox at IGT, we think we understand it now. We will give our understanding of how it works.
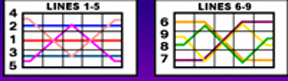
Here is what the bottom window looks like when the wheels stop spinning:
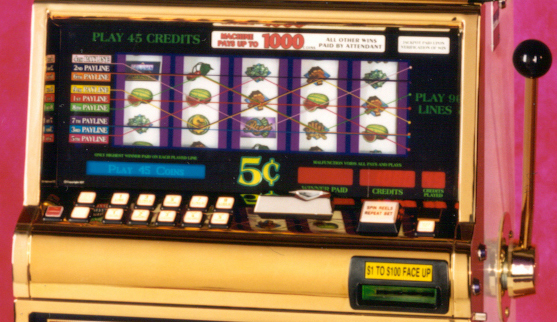
You see three horizontal rows and also wiggly lines that go through these three rows. There are six such lines, each a different color. These six wiggly lines and the three horizontal lines allow the player to make up to 9 plays simultaneously for each spin the wheels. Here is a clearer picture of the 9 lines:
The player chooses how many lines from 1 to 9 he wants to play and how many nickels from 1 to 5 that he wants to bet on each of these lines. He does this by pushing the appropriate buttons at the bottom of the screen. These buttons give the player the following options:
| Number of lines. |
1 |
3 |
5 |
7 |
9 |
| Number of nickels bet on each line | 1 |
2 |
3 |
4 |
5 |
There is an additional button called "maximum bet" that he can use if he wants the maximum bet -- 9 lines and 5 nickels The player must take the maximum bet to have a chance at the million dollar jackpot that we will discuss later.
Having made his choice the wheels will spin and come to a stop showing the three rows of the outcomes for the five reels.
The video screen in the middle of the slot machine will then show the winning lines. Here is the result of a spin that resulted in line 7 being a winning line.
The player can push the "help" button to see how much he won from the following three charts:
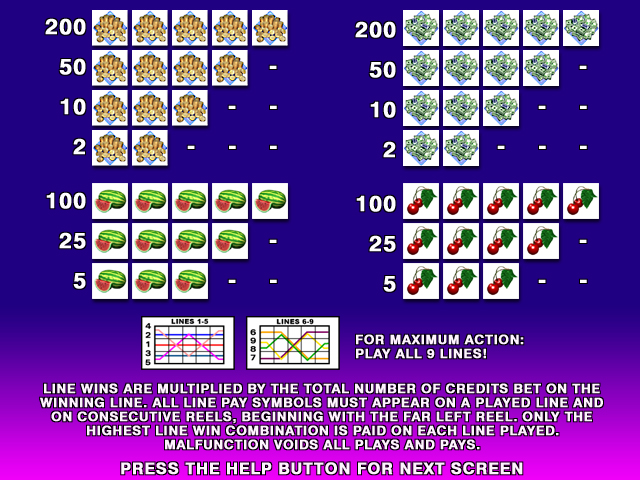
In our example the player bet on line 7 and there were three watermelons starting at the far left so the player is credited with 5 times the number of nickels bet. A second chart provides information about the jackpot:
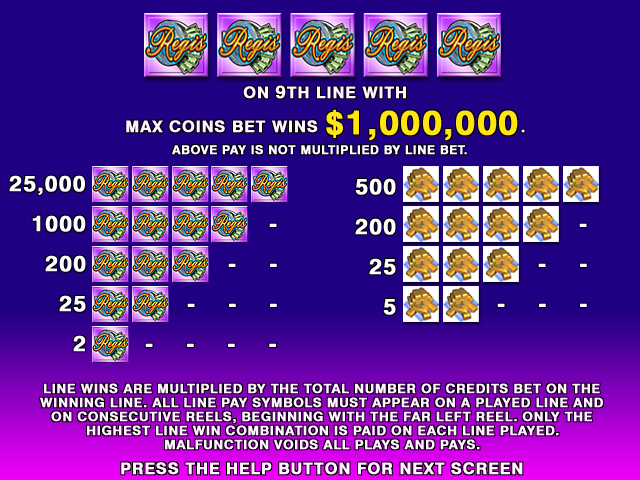
From this we see that if the player has three Regis symbols starting from the left he is credited with 200 times the numbers of the amount of the bet. If the player chooses the maximum bet, and if all five symbols on the 9th line are Regis symbols the player wins the jackpot.
This is a"progressive jackpot". This means that the jackpot has a "base value", in this case $1,00,000, and every dollar put in the machine contributes a certain percentage, usually 1%, to the jackpot. When the jackpot is won it is reset to the base value. In Nevada the Regis' Cash Club machines are all connected and all contribute to a single jackpot. At the time this was written the Regis Cash Club jackpot in Nevada was $1,654,992. The last time that jackpot was won was May 23, 2002 and the amount won was $1,500,000.
Finally, there are various bonus's that the player can win indicated on the following chart:
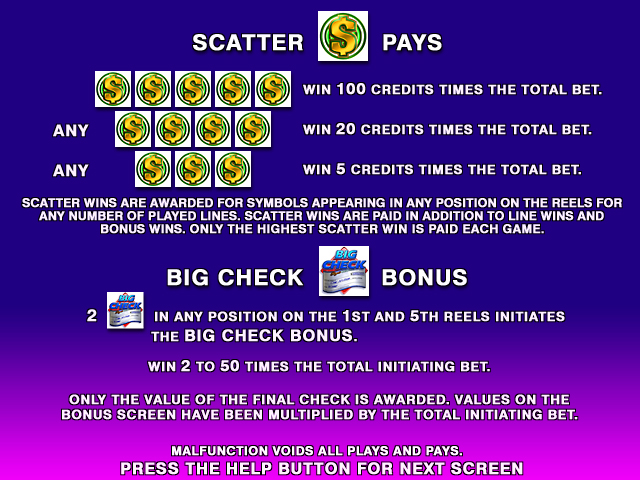
From this we see, for example, that if you get four scatter symbols (S) in any positions on the reels you are credited with an additional amount equal to 20 times the amount you bet.
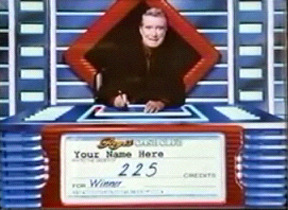
The Big Check bonus, is initiated by two or more Big Check symbols on any position on the 1st and 5th reels. If you have this, Regis appears and writes you a bonus check in the range of 2 to 50 times the number of nickels you bet. Sometimes, after writing the check, Regis will say he thinks it is too small and write a bigger check.
Another bonus is called the Column of Cash bonus. It is based on the following column shown next to Regis at the top of the slot machine:

There are five buttons labeled R E G I S. When you push one of these buttons, called a "pick", you see one of the following six phrases:" Up 1 Level," "Up 2 Levels," "Up 3 Levels, Free Pick," "Top 2," and "Trade up." You are allowed 4 picks which help you move up the ladder. If a pick asks you to move up a certain number of levels you will do so. If you get "Free Pick" you get another pick. If you get "Top 2" then the hidden message under the other four buttons ask you to move up. The two lowest levels are exposed and you are asked to cho0se between the other two buttons. Finally, the "Trade Up" button prompts you to select another button. If your second selection is the "Up 3 Levels" button you must move accordingly. If your second selection is either an "Up 1 Level" or an "Up 2 Levels" option, you can either keep the option or choose again.
Well, this gives you an idea how complicated these machines are.It also shows that they are carefully designed to keep the player playing and having a good time. The requirement that you must make the maximum bet to win the jackpot encourages you to invest 45 nickels in each spin. All rewards are expressed in terms of nickels so you always think you are not investing much money at any one time. For players who choose the maximum bet there is some payoff about every other spin of the wheels.
The climb up the ladder guarantees some payoff and it is very easy to move up the ladder but very hard to get to the top. You often see that you were very close to a jackpot but you don't quite make it. These are called "near misses". And of course, you enjoy listening to Regis or, on another machine to Frank Sinatra , or watching a large wheel spin around on the "Wheel of Fortune" slot machine.
In the classical slot machine it was reasonable to assume that the reels were equally likely to stop at any particular symbol on the wheel. This is not necessarily the case in modern slot machines. The story of how this came about is interesting. Here it is told by Dan Koeppel in a Popular Science article "Money Wired", November 2002.
Net Vegas was conceived in the early 1980s. Linked
slots didn't yet exist, but for the first time mechanical units were being replaced
by electronic ones, just as Pac-Man was pushing aside pinball machines in the
arcades. The era began with an attempt to dispense with traditional spinning
slot machine reels in favor of video displays. It didn't go well, initially.
Outside of a military battlefield, there is probably no harsher testing ground
for new tech than a gambling floor. "A game," says the R&D director
at IGT, Bill Wells, "needs to be productive the moment it hits the casino
floor." The reel-free slots were odd-looking. Players hated them.
Meanwhile, Wells and his team had developed their first notions of networked
jackpots. But the rejection of video systems raised a problem: It was physically
impossible to load a standard 20-inch reel with enough symbols—or stops—to
get the odds needed for networked, multiplayer play; there were too few stops
on each reel. "You can't create odds of millions to one on three or four
spinners," Wells says. Five-reel units were tested. They yielded enough
permutations, but confused players.
The solution came from a theoretical mathematician named Inge Telnaes. In 1984,
the Norwegian scientist—who'd left IBM to work for Bally's in Reno—was
granted a patent for an Electronic Gaming Device Utilizing a Random Number Generator
for Selecting the Reel Stop Positions. The language Telnaes used to describe
his Eureka concept was dry: "Players perceive larger machines," he
wrote, "as being less 'good' in terms of winning and payout chances. .
. . Large physical machines and a large number of reels develop an attitude
in the player which . . . may be more influential on whether or not the machine
is played than published figures showing the payoff odds. Thus, it is important
to make a machine that is perceived to present greater chances of payoff than
it actually has, within the legal limitations (in which) games of chance must
operate" (italics added).
That last sentence is the guiding principle of Net Vegas. Every game—slots,
cards, sports betting, even bingo—is now attempting to adapt a Telnaes-style
solution: Decrease the odds without increasing apparent complexity. That allows
bigger prizes, which increases—by staggering quantities—the amount
of money people are willing to gamble: In gambler-think, 10 bucks for a shot
at a few thousand dollars is one thing; a hundred bucks for a shot at millions
is another, even if the odds are much, much worse.
The Telnaes system, bought by IGT and licensed to
other manufacturers, essentially uses one virtual slot machine reel—with
a large number of stops—to control the more limited permutations of each
traditional mechanical slot machine reel. The stopping point of the microprocessor-driven
virtual reel is determined by a random number generator; the relationship between
the many stops on the virtual reel and the fewer stops on the mechanical reel
is predetermined by a formula, and weighted to ensure that "near misses"
appear to happen often. The gambler, in other words, is playing against three
random number generators while looking at the sort of old-fashioned, mechanical
spinning reels that seem to communicate a reassuring, physical limit to the
odds. Even wholly digital slots often emulate the effect of a spinning reel.
One might argue that the appearance of equally likely outcomes that are not equally likely and being able to control the probability of a near miss might be considered illegal.
The regulation of gambling in general and slot machines in particular is done on the state level. In Nevada this is done by the Gaming Control Board and in New Jersey by the Division of Gaming Enforcement. The most well known regulation relates to the percentage of money taken in by a slot machine that is paid out to the players. In Nevada the pay back must be at least 75% and in New Jersey at least 83%. In practice the slot machines typically give back between 83% and 98% with machines that require the most money to play having the higher return rate.
The casinos are not required to provide this information and, of course, it cannot be computed without knowing the computer program which runs the slot machine and this is proprietary information. Our favorite gambling expert Michael Shackleford who maintains the website The Wizard of Odds was able to obtain, for a number of slot machines, the relevant probabilities need to compute the return rates. Here are his estimates for the average return of slot machines depending on their coinage:
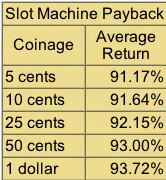
The question of legality of "near misses" and other regulations is discussed by Steve Bourie in an article " Are Slot Machines Honest?" in the 1999 American Casino Guide.
In this article he discusses an ABC News show Prime Time Live program that discussed the issue of "near misses". This is followed by interviews with Greg Gale of the Nevada Gaming Control Board and William Richardson of the New Jersey Division of Gaming Enforcement.
These representatives explain that when new slot machines are produced they must obtain a licence and provide the computer chips to be tested. They explain how they are tested and how they are regularly tested while in use in the casinos. We found the following interchange with Gale interesting.
Bourie: I saw the recent Prime Time Live show about
slot machines and it implied that many of your machines have a "near-miss"
feature. I thought that the "near-miss" was outlawed. Is that correct?
Gale: That’s correct. There was a case that involved an attribute that
was labeled "near-miss" and that relates back to Universal Distributing
Company in 1988. The process that they were using, which was deemed at that
time to be a "near-miss" feature, was not in accordance with the regulations.
What they would do was after they selected the reels, if you had a losing combination
they would present a different losing combination that was more like 7, 7 and
7 just below the line. It was outlawed because it didn't just independently
select the reels and then display the results to the player. It independently
selected the reels and if it didn't like the results that it came up with it
went to another table and randomly selected a different set of results to show
to the player.
Gale: But you’re right (about it being outlawed) since regulation 14 was
amended back in 1989 to prevent that type of activity.
What Gale was referring to here was the section of Nevada’s gaming laws
that was completely updated in 1989 and applies to "manufacturers, distributors,
gaming devices, new games and associated equipment."
Regulation 14.040 pertains to minimum standards for
gaming devices and parts of it specifically state "All gaming devices submitted
for approval: must use a random selections process to determine the game outcome
of each play of a game. Each possible combination of game elements which produce
winning or losing game outcomes must be available for random selection at the
initiation of each play. The selection process must not produce detectable patterns
of game elements. After selection of the game outcome, the gaming device must
not make a variable secondary decision which affects the result shown to the
player." The wording in those regulations seemed to adequately sum up the
state’s position on the "near-miss" scenario: it’s illegal.
Bourie goes on to say:
In the August 1997 issue of Casino Journal, a respected
trade publication that follows the casino industry, writer Jeff Burbank reported
that while a "near-miss" on the payline is outlawed in Nevada, a "near-miss"
above or below the payline is perfectly legal in that state.
Burbank interviewed Ellen Whittemore, the former deputy attorney general for
gaming in 1988 and 1989 who was responsible for writing Nevada’s Regulation
14 which pertains to the "near-miss" situation. She said that a "near-miss"
above or below the payline was legal and that actually it was better for the
players because it meant that players could more easily win jackpots.
Whittemore said that because of the virtual reel technology and the random number
selection process it is just natural that "near-miss" combinations
would appear more frequently above or below the payline. The Nevada Gaming Commission
held extensive hearings on this subject and on September 22, 1988 it filed a
stipulation declaring it legal.
Pretty confusing, isn't it? Well, the important thing to remember here is that
although a "near-miss" is acceptable above or below the payline, it
can’t be programmed into the machine. It is only allowed when it’s
the result of a random number generation process that just happens to put those
particular results on the reel. If a "near-miss" is purposely programmed
to appear either above, below, or directly on the payline, then that would be
illegal in any regulated gaming jurisdiction.
And how does this story affect you? Well, at least when you walk into a casino
and play a slot machine in a regulated jurisdiction you can be assured that
measures have been taken to assure you of a fair game. You can also be assured
that a "near-miss" won’t be programmed to appear on the payline,
but I suggest that you don’t look above or below that payline to see what
else is showing!
DISCUSSION QUESTIONS:
(1) Slot machines pay back about 90 percent of the money they take in and lotteries only pay back about 50 percent of money it takes in. Does that mean that you are better off playing slot machines? What additional information might you want to have to decide this?
(2) What information do you think makers of slot machines should be required to make public?
Copyright (c) 2004 Laurie Snell
This work is freely redistributable under the terms of the GNU General
Public License published by the Free
Software Foundation. This work comes with ABSOLUTELY NO WARRANTY.