CHANCE News 12.01
1 January to 28 February 2003
Prepared by J. Laurie Snell, Bill Peterson, Jeanne Albert, and Charles
Grinstead, with help from Fuxing Hou and Joan Snell.
We are now using a listserv to to send an e-mail notice that a new
issue of Chance News has been posted on the
Chance Website. You can sign on or off or change your address at
this Chance listserv.
This listserv is used only for mailing and not for comments on Chance
News. We do appreciate comments and suggestions for new articles. Please
send these to:
jlsnell@dartmouth.edu
The current and previous issues of Chance News and other materials
for teaching a Chance course are available from the Chance
Website.
Chance News is distributed under the GNU General Public License (so-called
'copyleft'). See the end of the newsletter for details.
It is easy to lie with statistics, but
it is easier to lie without them.
Frederick Mosteller
Contents of Chance News 12.01
1. Forsooth.
2. Exercises for the UK Lottery from John Haigh.
3. A discussion question.
4. Paulos on false positives in searching for terrorists.
5. Some bargains to liven up your probability or statistics
course.
6. The Ellsberg paradox.
7. More may not be better, Medicare study says.
8. Traffic citations reveal disparity in police searches.
9. Death penalty found more likely when victim is white.
10. Auto safety czar warns drivers of SUV danger.
11. Study shows teenagers prefer their toothbrush.
12. Probabilistic risk assessment .
13. Answers to John Haigh's UK Lottery questions.
Here is a forsooth item from the January 2003 issue
of RSS News.
If you like statistics, it can cover a 0 to 1000-mile
distance in 32.4 secs.
Report on Peugeot 307
Motoring & Leisure
July/August 2002
Science writer Richard Robinson provided the following forsooth item
on the science writers listserv.
In an Associated Press article
on ABC news we find:
Headline: Thousands Worldwide Protest
War in Iraq
Sub-head: Hundreds of Thousands Worldwide Open Day
of Rallies Against Possible Military Action in Iraq
Lead: Millions of protesters many of them
marching in the capitals of America's traditional allies demonstrated
Saturday against possible U.S. plans to attack Iraq.
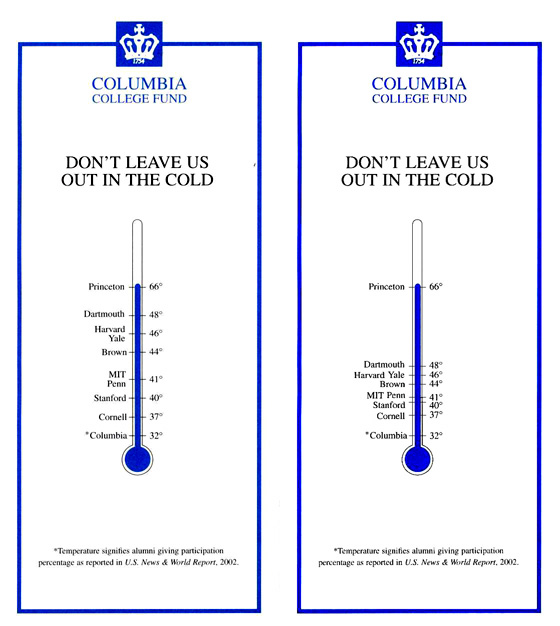
An alumnus of Columbia College (whose name we misplaced) sent us the
following Forsooth item:
Columbia College Alumni received in a mailing the graph on the left.
Our reader pointed out that if the correct scale is used, shown in the
graph on the right, Dartmouth does not look so good. Also Columbia does
not look so bad being only 16% below number 2 Dartmouth.
The January 2003 RRS News also had the following interesting
commentary:
John Haigh looks back over the statistics thrown
up in eight years of the UK national lottery and poses some tasks for
those who fancy some recreational exercise in probability.
Readers of Chance News will recall that Haigh wrote a wonderful book
"Taking Chances" published in 2000 by Oxford Press that we
discussed in
Chance News 8.06.
Here Haigh suggests that a number of statistical ideas can be illustrated
using lottery data relating to the UK national lottery. This data is
available at Richard Lloyd's
Website website. At this website Lloyd provides the winning numbers
and the total sales for all UK National Lotto drawings to date. Similar
sales data is not available for the Power Ball lottery which made it
difficult for us to estimate the chance of multiple winners of the jackpot
when we tried to estimate of the expected winning for a Power Ball lottery
ticket in our
discussion of how to use lotteries in a probability or statistics
course.
Lloyd's website automatically updates the data after each drawing.You
can see how you would have done if you had bought a ticket for any particular
drawing. It is a sobering experience to see how far your six numbers
typically are from the winning numbers. You can also see how you would
have done if you had bought tickets to cover all possibilities for a
particular drawing. If you had done this for every drawing up to 12
February 2003 you would have lost £ 5,912,282,506. Other interesting
statistics are provided.
In this RSS commentary, John describes how to estimate the probabilities
for a number of interesting events in the lottery. For example the longest
period of time that a number was absent from the winning six numbers
in the UK National Lottery was the 72 consecutive drawings from 26 Feb.
2000 to 1 Nov. 2000 when our lucky number 17 did not occur. He remarks
that the mean frequency of some absence for r consecutive draws in n
draws is
m = 49* (n-r) *(43/49)^r.
At the time that John wrote this commentary there had
been 721 drawings. Putting n = 721 and choosing r = 70,75, and 80, he
obtained mean frequencies of 3.4, 1.8, and .1 suggesting that 72 consecutive
absences is actually shorter than we might have predicted.
Haigh remarks that his "most remarkable statistic"
is the 133 who shared a 16,293,830 pound jackpot in the UK National
Lottery on January 14, 1995. The winning numbers were 7, 17, 23, 38,
42 showing the public's love of the number 7 and its multiples.
DISCUSSION QUESTIONS:
John includes seven tasks for your entertainment. His
answers are given at the end of this Chance News.
In the UK National Lottery the winning numbers are 6 distinct
numbers from 1 to 49 called"main numbers" and one additional
number from 1 to 49 called the "bonus number."
(A) How often would you expect the most frequent
and the least frequent main numbers to arise? (The mean and
variance of the frequency of any one integer should be about 88.3 and
77.5.)
(B) How many draws were/should be needed until each number has arisen
at least once as a bonus number?
(C) How many draws were/should be needed until we achieve
a complete collection of main numbers? How many draws until we achieve
a complete collection of pairs of main numbers?
(D) What is your guess for the length of the maximum run
to date?
(E) Overall average sales are about 45 million. So, over
721 draws guess the frequency of no jackpot winners.
(F) Guess the modal number of jackpot winners.
(G) Guess the smallest number n for which there has not
yet been exactly n jackpot winners.
Norton Starr suggested the following
discussion question:
Norton commented that in the New York Times Science Times (4
Feb, 2003) there was an article on herbal remedies by Jane Brody with
the following paragraph:
But as Dr. Peter A. G. M. De Smet of the Netherlands
recently stated in The New England Journal of Medicine, "If
an herb caused an adverse reaction in 1 in 1,000 users, a traditional
healer would have to treat 4,800 patients with that herb (i.e., one
new patient every single working day for more than 18 years) to have
a 95 percent chance of observing the reaction in more than one user."
DISCUSSION QUESTION:
Recall that Arnold Bennett, in his Chance Lecture "Risk
in Everyday Life," estimates the risk of death by flying to
be about 1 in 7 million. He remarked that his first idea of how to explain
how small this risk is, was to say that it is comparable to winning
the Massachusetts lottery. However, he then realized that most people
expect to win the lottery and remarked that "this juxtaposition
of their worse fears and greatest hopes did not work." Instead
he found it more useful to tell them that they would have to take a
flight every day for 19,000 years to have a reasonable chance of dying
in an airplane crash. They would then say "hey, I'm not going to
live that long!" and be at peace with flyng.
Is de Smet's estimate of 4,800 patients correct? Do you think his way
of describing a 1 in a thousand chance for an adverse reaction would
seem less frightening or more frightening to someone being treated with
the herb?
Future
world: privacy, terrorists, and science fiction.
ABCnews.com, 5 Jan. 2003
John Allen Paulos
John starts this column with:
Remember the trial in Alice in Wonderland where
the sentence precedes the verdict? Not only did last summer's movie,
Minority Report, borrow the theme, but so too does the federal government
as it hunts for would-be terrorists.
John is referring, in particular, to a Pentagon surveillance program
called "Total Information Awareness (TIA)" headed by John
Poindexter, the retired admiral who was in charge of the Reagan administration's
illegal Iran-contra operation. The official motto of TIA is "Scientia
Est Potentia," (knowledge is power). Their program is designed
to use modern computer science methods and the networking power of the
internet to gather information of individual and groups in the hopes
of finding suspicious patterns of behavior that might identify terrorists.
Of course this information would include our credit card transactions,
telephone conversations, books ordered from Amazon, web sites visited
etc.
John uses the familiar properties of false positives to suggest that
this process might have some problems. He writes:
Assume for the sake of the argument that eventually
(maybe by 2054), some system of total information-gathering becomes
so uncannily accurate that when it examines a future terrorist, 99 percent
of the time it will correctly identify him as a pre-perpetrator. Furthermore,
when this system examines somebody who is harmless, 99 percent of the
time the system will correctly identify him as harmless. In short, it
makes a mistake only once every 100 times.
Paulos then assumes a population of 300 million people of whom 1,000
are future terrorists. Then the system will correctly identify 990 future
terrorists which is pretty good. However, it will also identify 1% of
the other 299,999,000 people or 2,999,990 who are not terrorists as
terrorists, leading "the system to swoop down on 2,999,990 innocent
people as well as on the 990 guilty ones, apprehending them all."
Since Paulos wrote this article the Senate and House conferees accepted
a bipartisan Senate provision stipulating that the TIA program cannot
be used against American citizens. The conferees also agreed to end
research on the program in 90 days unless the Pentagon submits a detailed
report on the programs' cost, goals, impact on civil liberties and prospects
for success against terrorists.
Of course, whatever the outcome of TIA, the government will certainly
continue to use information about us available from the internet and
so Paulos' concerns will continue to be relevant.
There is a similar discussion of the problems of false positives in
the use of polygraphs to identify in a recent report"The Polygraph
and Lie Detection" of the Committee to Review the Scientific Evidence
on the Polygraph, National Research Council chaired by the well known
statistician Stephen Feinberg. The report is freely available on the
web here (sadly
one page at a time). In an editorial in the Washington Post (17 October,
2002) we read
The report hypothesizes that in a population of 10,000
employees that includes 10 spies, 1,606 loyal employees will fail a
test sensitive enough to identify eight of the bad guys. And if the
test's sensitivity is set so as to reduce the number of loyal employees
implicated to 40, it will then net only two of the spies.
This example, and much more about measuring the validity of poygraphs
can be found in Chapter 2: Validity and its Measurment of the
report.
DISCUSSION QUESTIONS:
(1) If the Pentagon submits a report on the TIA program to Congress,
do you think the false positive issue will be addressed? Do you think
it should be?
(2) Those who supported the TIA program stated that the program will
only be looking for patterns of behavior that suggest terrorist activity.
If they are correct, is the false positive problem still a concern?
The the current price of probability and statistics
books being what it is, it is nice to find some bargains. Here are three
we found, browsing Amazon, that can liven up your statistics or probability
courses.
Games, Gods and Gambling: A History of Probability and Statistical
Ideas.
Dover 1998, $9.95 at Amazon.
by F. N. David
Your students will enjoy reading the early history of probability,
especially the letters between Pascal and Fermat included in this book.
If you are lucky enough to find Renyi's "Letters on probability"
in your library they will also enjoy the sequel to these letters found
in an attic.
Fifty Challenging Problems in Probability With Solutions.
Dover, 1989, $5.95 at
Amazon
by Frederick Mosteller
In our opinion, this is still the best collection of elementary probability
problems ever assembled.
Your Intuition Is Wrong!
Dorrance, 1996, $9 at Amazon
by Marc T. Simon
Here you will find 29 problems that challenge your intuition. As the
author remarks, they are based primarily on results found in Feller's
classic probability book. Solutions are provided.
These problems are consistent with our belief that 95% of the important
ideas of probability are best illustrated in terms of coin-tossing.
John Gagnon wrote us, that in the New Yorker
(November 4, 2002) review of Daniel Ellsberg's memoir about the Pentagon
papers (and his life in general), there is a discussion of the "Ellsberg
Paradox". This paradox occurred in Ellsberg's 1962 PhD thesis in
Economics from Harvard. The New Yorker article describes this
paradox as follows:
The paradox arises from a series of games involving colored
balls in urns. Let's say there are two urns, each of which contains
a hundred balls, which are either red or black. One urn contains fifty
red balls and fifty black balls. The proportion of red and black in
the other urn is unknown. You can draw one from from one of the urns,
without looking, and if you draw a red ball you win a hundred dollars.
Which urn will you choose?
There is no good reason to think that the chance of getting
a red ball is any better in one urn than in the other, but Ellsberg
found that people overwhelmingly chose the urn known to have fifty balls
of each color. The person running the game would then say, "OK,
you think that urn is likelier to have a red ball; now I'm going to
offer you a hundred dollars if you draw a black ball." If you turned
to the fifty-fifty urn for the red ball, it would seem you had a hunch
that the other urn contained more black balls, and therefore you should
try to draw your black ball from it. But, overwhelmingly, people chose
the fifty-fifty urn again. The Ellsberg paradox is that people so strongly
prefer definite information over ambiguity that they make choices consistent
neither with the laws of probability nor with themselves.
Gagnon remarked that he did not see anything paradoxical about this
and wondered if the New Yorker has accurately reported Ellsberg's
example. We looked this up and will explain more carefully what Ellsberg
said about this example. We leave it to the reader to judge how accurate
the New Yorker was.
Such an example was introduced by Ellsberg in his PhD thesis. His thesis
was on decision theory at a time of major developments in statistical
decision theory and the related topics of subjective probability and
utility functions. An important contribution to this was Savage's book
The Foundations of Statistics (1954). This book considered
subjective probability and utility. It started with six axioms believe
to be reasonable for a person's preferences.These axioms were motivated
and discussed, and from these are deduced the existence of a subjective
probability and a utility function. In his thesis Ellsberg's used this
urn example as an example in which people's prferences violated one
of Savages' axioms. You can find Savage's axioms here.
Here is Ellsberg's version of the New Yorker example.
As in the New Yorker article,we are told that
there were two urns; urn1 which has 100 balls and you have no information
about how many of the balls are red or black, and urn 2 which you are
told has 50 red balls and 50 black balls. A red bet
is a bet that the ball you draw is red and a black bet
is the bet that it is black. In either case if you win your bet you
get $100.
You are then asked if you prefer a red bet or a black
bet or if you are indifferent to which color you bet on. Most people
say they are indifferent.
Then you are asked if you are offered a red bet would you prefer drawing
from the urn 1 or urn2. Most people say they would prefer urn 2, the
urn with known compositon. Similar you are asked if you were offered
the black bet would you prefer drawing from urn 1 or urn 2. Again most
people answer that they would prefer drawing urn2.
Now consider a person who is indiferrent as to whether they make a
red bet or a black bet and who says they would prefer urn 2 in both
cases. Then for these beliefs to be described by a probability measure
this would mean that they believe it is more likely that a red ball
will be drawn from urn 2 then from urn 1 and they also believe that
it is more likely that a black ball will be drawn from urn 2 than urn
1 which violates properties of probabilities.
Ellsberg's paradox has been the subject of a large number of papers
by economists and mathematicians. A search on JSTOR
will find 29 such articles with references to many others. One of these
is by Ellsberg. Ellsberg has also written a recent book "Risk,
Ambiguity and Decision", Routledge publishers 2001, based on his
thesis.
DISCUSSION QUESTIONS:
(1) Did the New Yorker get it right?
(2) Do you find Ellsberg's example paradoxical?
More may not be better, Medicare study says.
Los Angeles Times, 18 February, 2003
Carla Hall
Medicare:
More may not be better.
NPR All things considered, 17 February 2003
The
implications of regional variations in Medicare spending. Part I:
Content,quality, and accessibility of care.
Annals of Internal Medicine, 18 February, 2003, 274-287
Fisher, Wennberg, Stukel, Gottlieb, Lucas, Pinder.
The
implications of regional variations in Medicare spending. Part II:
Health outcomes and satisfaction with care.
Annals of Internal Medicine, 18 February, 2003, 288-298
Fisher, Wennberg, Stukel, Gottlieb, Lucas,Pinder.
Geographical
Variations in Medicare Spending
Commentary by Kenneth I. Shine, MD
John Wennberg lived in a small town in Vermont when his son had trouble
with his tonsils. A hospital on one side of the mountain said that they
normally operate and a hospital on the other side of the mountain said
that they normally did not operate. This led Wennberg to wonder who
much variation there was in the treatment of standard medical problems.
For the past 35 years he has been trying to answer this question and
studying the consequences of the resulting variation. To answer some
of these questions he and his colleagues developed the Dartmouth
Atlas of Health Care.
In developing the Atlas, the authors divided the country into 308 regions
called Hospital Referral Regions (HRRs). These regions had
an average population of about a million and consisted of the hospitals
in a particular area that had common referral hospital or hospitals
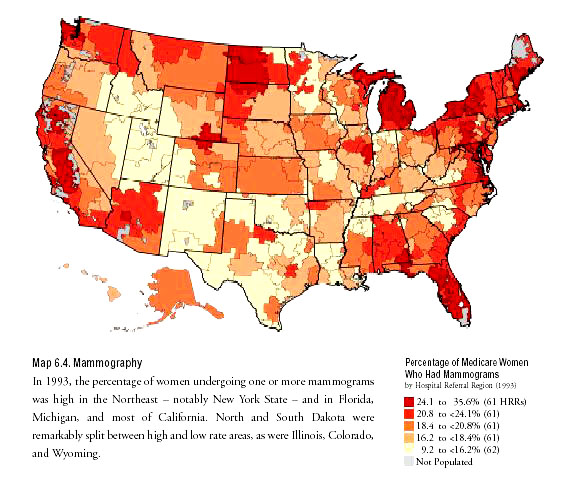
for major heart surgery or neurosurgery. Here is a typical picture from
the 1996 Atlas showing the variation in these regions in the proportion
of Medicare women who had a mammogram in 1993.
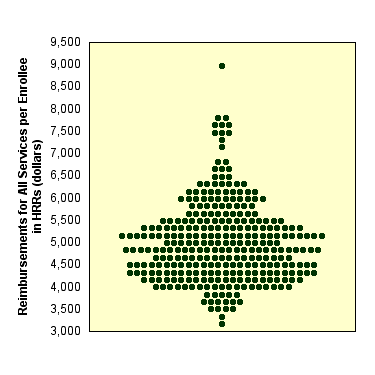
It is well-known that there are regional differences in Medicare spending.
In the current Atlas we read:
In 1996, Medicare payments for services reimbursed on
a fee-for-service basis (including non-risk bearing health maintenance
organizations) averaged $4,993 per enrollee. Per enrollee reimbursements
varied remarkably among hospital referral regions, even after adjustment
for differences in population age, sex, race, and illness factors, and
for differences in regional prices. Reimbursements were almost three
times higher among residents of the McAllen, Texas hospital referral
region ($9,033) than among residents of the Lynchburg, Virginia hospital
referral region ($3,074).
The variation is illustrated by the following graph:
The aim of the studies reported in the two articles in the Annals
of Internal Medicine was to determine if regions with higher Medicare
spending per capita provide better care.
Of course it would be nice to be able to randomly assign patients
to hospitals in these regions and see whether those in areas of high
Medicare spending per capita do better than those in areas of low Medicare
spending per capita. However this is not very practical.
A simple comparison of patients in regions with different levels of
Medicare spending will not work since the patients in one region may,
for example, be generally healthier than those in the other region.
In other words there could be selection bias.
The authors of these papers use a method called "natural randomness"
to try to eliminate selection bias. The idea is to try to divide the
HRRs into groups in such a way that there is no reason to believe that
the health profiles would be different within the different groups.
They do this as follows:
They define an index called the End-of-Life Expenditure Index
(EOL-EI). This is the average per capita resource use by Medicare enrollees
in their last 6 months of life in each of the 306 U.S. Hospital Referral
Regions (HRRs). To avoid variation in costs of medical procedures, lab
costs, physicians services etc. the authors use national averages for
all money calculations. See the author's
appendix for details on how they achieved this. This appendix, which
does not appear in the published version, also provides more details
on other aspects of the author's study.
The HRRs are then ordered from lowest to highest value of the EOL-EI.
Then this ordered list is divided into five quintiles of approximately
equal size, based on the entire Medicare population older than 65 years
of age. Here is a graph indicating in which quintile the HRRs fall.
The brighter colors indicate quintiles with greater per patient Medicare
spending.
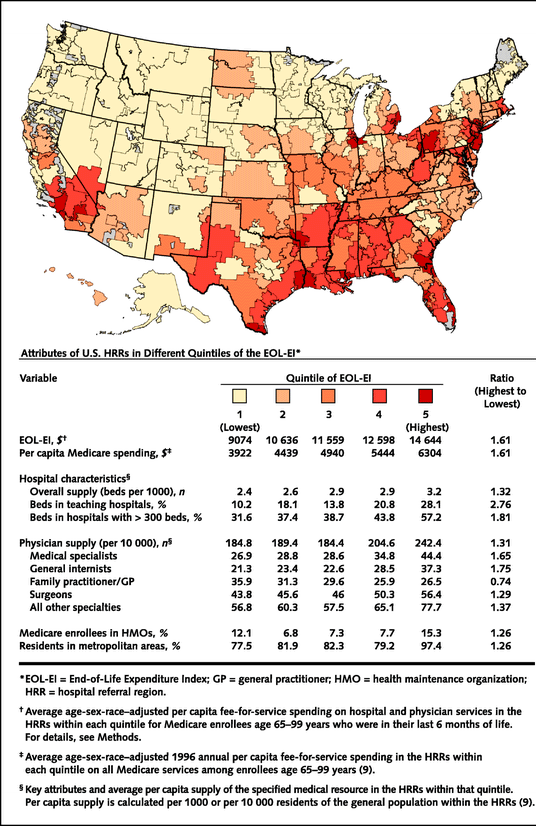
From the notes we see that there are significant differences in the
per capita Medicare spending in the quintiles and also significant differences
in the hospital resources. Those with higher per capita spending have,
for example, more beds, more medial specialists and fewer family practitioners.
The authors provide evidence that these quintiles do have similer medical
profiles as desired. They do this by looking at data from several sources.
One of these is from "The Medicare Current Beneficiary Survey (MCBS)"
which provides a reprentative sample of Medicare patiants who are continuously
interviewed regarding their health problems. The authors looked at the
data for all participants older than 65 with initial interview between
1991 and 1996, excluding HMO members and those not eligible for Medicare
Part A or Part B. This was a sample of size 23,902. From the information
available from this survey they provide the following comparisons of
demographic and health conditions between the four quintiles.
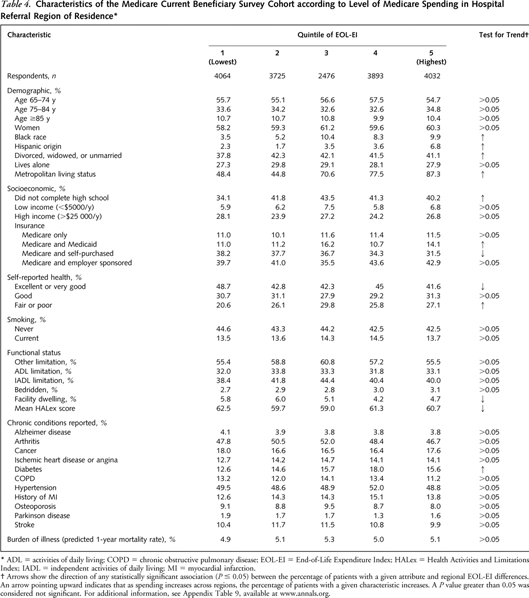
We see from this that the health profile is quite similar between quintiles
though in the demographics the groups with larger per-capita spending
have more minority patients.
Having satisfied themselves that the quintiles have reasonable satisfied
the conditions for "natural randomization" the authors study
4 different patient groups to see if those in the higher per-capita
Medicare groups obtained a better quality of care and better health
outcomes. For this they study the patients in the Medicare Current Beneficiary
Survey and three other groups of Medicare patients within a 2 or 3 year
period before 1996. One group consisted of patients who have had a heart
attack, another of patients who had had colorectal cancer, and a third
group who have had a hip replacement.
Based on their study of these four groups of patients the authors conclude:
Regional differences in Medicare spending are largely
explained by the more inpatient-based and specialist-oriented pattern
of practice observed in high-spending regions. Neither quality of care
nor access to care appear to be better for Medicare enrollees in higher-spending
regions.
On the Atlas website you
can find videos of a
lecture series called "Unwarranted variations and their remedies."
Part four is related to the research reported in the these two articles.
The results of these two studies are nicely illustrated in this video.
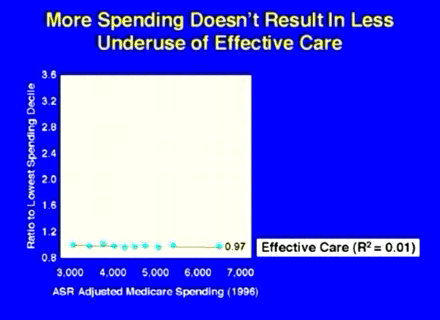
Here are some of the graphs shown in the video.
The first graph indicates the correlation between the Medicare spending
per capita and the author's index of "effective care". Effective
care involves procedures for which studies have demonstrated their effectiveness.
The next graphic shows what you do get in a hospital having higher
per capita Medicare payments.
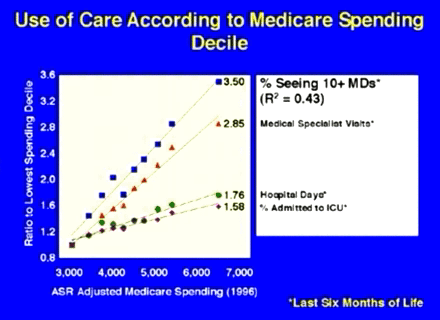
As you can see from this graph you get more time in intensive care,
more days in the hospital, see more specialists and have a much better
chance of seeing ten or more doctors!
In their second paper the authors estimate the relative risk for death
over 5 years for residents of the HRRS quintiles 2,3,4 and 5 (the higher
quintiles) compared with residents of HRRs in the lowest quintile. The
results are shown in the following figure.
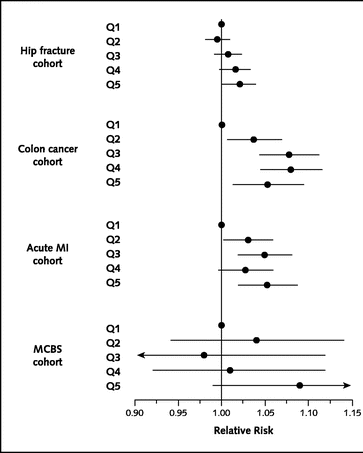
The more Medicare pays, the less your chance of surviving!
The authors begin their papers by stating:
Health care spending in the United States is expected
to increase dramatically in this decade. By 2011, per capita spending
is forecast to increase by 49% in real terms reaching $9216 per capita
or 17% of the gross domestic product.
On the NPR program it is stated that if Medicare payments in all quintiles
were reduced to those in the lowest quintile this would reduce Medicare
spending by about 30% or about 75 billion dollars a year.
While the authors results suggest that this would result in lowering
quality of care of the patients, they admit that it is difficult to
see how this could really be done. However, it is clear that the results
obtained by Wennberg's group could have a serious impact on political
decisions and so are good examples of the interplay of statistics and
public policy.
Your students can see this in action by listening to a lectures by
Carl Wennberg and others at the Kaisernetwork.org.
Here they can hear Wennberg's opinions on how Medicare could be reformed
and also Senator Jeffors discussing a bill (S-1756) he has submitted
to Congress to achieve some of Wennberg's proposals.
DISCUSSION QUESTIONS:
(1) If you lived on the border of a two HRR regions one of which was
in the first quintile and the other in the 5th quintile, which you choose
for your health care?
(2) As indicated by the arrows in the last column in Table 4 there
were some medical outcomes that were significantly different between
the quintiles. This occurred more often in the analysis of the other
three groups of patients studied. However, the samples was large and
the differences were small. Can this be ignored on the basis that it
the difference is not clinically significant?
(3) When using the method of "natural randomization" the
fact that the treatment groups are medically similar is an assumption.
It can never be completely verified since there may be unobservable
differences. The authors mention this possibility but do not seem too
concerned about it. Can you think it is a concern? If so why?
Traffic citations reveal disparity in police searches.
Boston Globe, 6 January 2003, A1
Bill Dedman and Francie LaTour
Totals, hometowns key to computations.
Boston Globe, 6 January 2003, A7
Bill Dedman and Francie LaTour
The problem of racial profiling by police in traffic stops and vehicle searches has received national attention starting a few years ago. Massachusetts decided to conduct its own study, which looked at all 764,065 traffic tickets issued from April 2001 to November 2002 by 367 police departments in the state. The Globe obtained the data under the state's open-information law, and produced this series of articles. The Globe maintains a
web page devoted to the investigation. Along with archives of the stories, your will find a variety of charts and graphics.
The data indicate that racial minorities are being ticketed and searched at disproportionate rates. Blacks make up 4.6% of the state's population, but got 10.0% of the traffic tickets; Hispanics make up 5.6% of the population, but got 9.6% of the tickets. Overall, one stop in 60 results in a vehicle search. However, for blacks and Hispanics, the rate is one in 40. A primary goal of the searches is to find illegal drugs, so an interesting variable is the "hit rate"; that is, the percentage of searches that actually lead to drug charges. It turns out that the hit rate is higher for whites, which makes the differential search rate even harder to explain.
The second article observes that because "you can get a ticket
when you are out of town...the race of people ticketed can't be compared
directly with a town's racial mix." Therefore, the Globe
"focused on drivers ticketed in their hometowns, so that the race
of the ticketed can be compared with race of the driving-age population
in that town." Details on the results are presented in the first
article, which notes that in 45 communities the black residents' share
of the tickets is at least four times their proportion of the population.
DISCUSSION QUESTIONS:
(1) Does the ticket analysis by hometown make sense to you? What are the advantages of this approach? Do you see any downside?
(2) Blacks fared especially badly in the hometown analysis, as noted above. But the article reports that minorities in general are disadvantaged: "In more than half the state's communities, minorities get a greater share of the tickets in the town where they live from the town's police than their share of the driving age population." Is this a Forsooth?
Death penalty found more likely when victim is
white.
New York Times, 8 January 2003, A12
Mark Memmott
In 2000, Governor Parris Glendening of Maryland launched an investigation of whether the death penalty was being fairly imposed in his state. The report from that study, which was just issued, considers 6000 capital cases from the past two decades. Overall, the findings were consistent with previous findings in other states, which have repeatedly found that the race of the victim is the crucial factor in determining whether prosecutors seek the death penalty. Specifically, the Maryland study found that the death penalty was sought more often in cases of blacks killing whites than in cases when blacks killed other blacks, or in cases when the killer was white. Race of the defendant did not appear to be a factor.
University of Maryland Professor Raymond Paternoster, who directed the study, cited the following dramatic illustration of the problem: "Baltimore County and Baltimore City are contiguous. But defendants in Baltimore County are 26 times more likely to get the death penalty." As the article explains, blacks make up a much larger proportion of the population in the City.
According to the article, Maryland has executed three convicted murderers since reinstating the death penalty in 1978. There are currently 13 prisoners on death row, eight of whom are black. All 13 were convicted of killing whites. However, during this period 55 percent of the cases where the death penalty could have been sought involved non-white victims.
DISCUSSION QUESTIONS:
(1) With so few convicts on death row, does the "26 times more likely" statistic for Baltimore County make sense? Or is something wrong here?
(2) Death penalty opponents and advocates both found support for their positions in the report. Richard Dieter of the Death Penalty Information Center lamented the finding that "in the death penalty, white lives are counted more than black lives." But Kent Scheidegger of the Criminal Justice Legal Foundation was encouraged by the finding that the defendant's race did not matter, and observed that "the death penalty reforms put in place since the 1970s to eliminate discrimination are one of the great successes of modern criminal law." Can both be right?
Auto safety czar warns drivers of SUV danger.
Wall Street Journal, 15 January 2003, A1
Karen Lundegaard
The National Highway Traffic Safety Administration (NHTSA) is again
warning drivers that SUVs are prone to rollover crashes, and putting
auto makers on alert that they may face federal mandates if they don't
take steps on their own to correct safety problems. Dr. Jeffrey Price,
who heads NHSTA, is a former emergency- room doctor. He worries that
the sheer size of SUVs convinces drivers that they are safe. Dr. Price
is quoted as saying, "The thing that I don't understand is that people,
when they go to buy a vehicle, they might go sit in it and say, 'Gee,
I feel safe.' Well, sorry, but you know gut instinct is great for a
lot of stuff, but it's not very good for buying a safe automobile."
According to the article, rollovers represent 3% of US motor vehicle
accidents but account for one-third of all deaths of vehicle occupants.
In 2001, there were 8400 deaths from single-vehicle rollover accidents,
up more than 20% from the previous year. The NHTSA is also concerned
about "crash compatibility" data related to SUVs and other light trucks.
When a car is struck by a large pickup truck in a side impact collision,
the occupants of the car are 26 times more likely to be killed than
the occupants of the truck. The figure for car-to-car collisions is
less than a third as large. Side-impact collisions are a current hot
topic as the automobile industry considers installing side air bags
in vehicles.
Naturally, the industry is concerned about the cost of any such improvements.
A Ford spokesperson said that the company does not think federal mandates
are appropriate and would rather see changes driven by the market.
DISCUSSION QUESTION:
In light of Dr. Price's comments, it might not appear that consumers are ready to demand changes. How do you think the NHTSA could present its data so that people would find it more compelling?
Study shows teenagers prefer their toothbrush.
Boston Globe, 21 January 2003, C2
David Arnold
A recent poll asked 400 teenagers to pick the invention that they could not live without. The response trumpeted by the headline--the toothbrush--sounds surprising, until you read further and learn that the poll only provided five choices. Here they are, with the percentage of respondents rating them #1 given in parentheses: the toothbrush (34%), the automobile (31%), the personal computer (16%), the cell phone (10%) and the microwave (7%).
The poll was conducted by the Lemelson-MIT Foundation, whose mission is to
encourage inventors. It is named for the late Jerome Lemelson, whose
inventions include contributions to bar- coding technology. The foundation
has conducted annual polls for the last eight years on various aspects
of inventing. You can read more on their web
page. For example, this year's poll was given to a sample 1000 adults
as well. Among the adults, the top two responses were the toothbrush
(42%) and the automobile (37%).
Last year's poll asked respondents to rank the top inventions of the
20th century, again from a list of five. The teens chose the personal
computer (32%), the pacemaker (26%), wireless communications (18%),
water purification (14%), and television (10%). The adults chose the
pacemaker (34%), the personal computer (26%), television (15%), wireless
communications (14%), and water purification (11%). The accompanying
press release on the web site quotes program director Merton Flemings
as saying, "The generational differences are quite striking. Teen
preference for mobile devices over television--the opposite of their
parents--is an interesting indicator of lifestyle changes ahead."
DISCUSSION QUESTIONS:
(1) How do you think the foundation settled on the five inventions for this year's poll? Knowing the list, are you still surprised by the results?
(2) This year's results seem to show less of a generational divide. Why do you think this might be?
What are the chances?
New York Times, 6 February, 2003, G1
Seth Schiesel
Dangers of gauging space safety; Effectiveness of NASA's risk assessments
is questioned.
Washington Post, 17 February 2003, A14
Guy Gugliotta and Rick Weiss
The Times story describes the methods of probabilistic risk assessment in applications that include hurricane forecasting, nuclear safety and the analysis of complex missions such as the space shuttle. In the mid-1990s, NASA estimated the risk of a catastrophic failure of the shuttle as 1 in 145 missions. At that time, the principal source of concern was determined to be the shuttle's main engines. The article reports that prior to the Challenger disaster, NASA had not shown much interest in probabilistic risk assessment.
The Post article echoes this view of NASA. It notes that three years after the 1-in-145 estimate, a number of safety improvements had been made, and the estimate was updated to 1-in-245. Still the article is critical of NASA's response to safety concerns, noting that many proposed improvements have gone unfunded. It quotes Theofanis G. Theofanus, of the Center for Risk Studies and safety at the University of California at Santa Barbara, as saying "Once you have done your risk assessment, money becomes a factor, so you decide what is an acceptable risk. There is at least a nominal understanding between the people who perpetrate the risk [NASA] and the people on the receiving end [the astronauts]. You take your chance."
The Times article discusses other risk scenarios as well. For example, it devotes considerable attention to estimation of hurricane damage. Continuing advances in computing power have made it possible to perform thousands of simulation runs which use historical data to predict future patterns of storms in terms of their frequency, intensity and path. Detlef Steiner, a mathematician at the Clarendon Insurance Group in New York, says that the most likely scenario for any given year would represent $50 million in liability for his company. He adds that "Every 100 years we might have $600 million. A thousand-year event might cost us a billion. But remember, a thousand-year event hasn't happened. A thousand-year event tells you Florida is gone."
According to the article, estimating insurance liability from hurricane
damage is actually much easier than modeling the reliability of a complicated
system like a the space shuttle or a nuclear plant. This is because
the insurers are only interested in the final outcomes, while engineers
must try to identify--and hopefully eliminate--the potential causes
of failures.
Trying to assess the threat of terrorism is seen as being more complicated
still, because of the human factor. Hemant Shah of the risk modeling
firm RMS explains that "hurricanes do not try to strike your weak
points. In the case of terrorism...you're modeling an adversary in the
context of conflict." Game theoretic modeling is now being applied to
study such situations.
Another article in the New York Times (You Can Bet on It, Playing the
Odds on War, 2 March 2003, Section 4: page 2, Sam Lubvell) reports that
gamblers have also estimated the odds of the United States lauching
an attack on Iraq.
For example on as of Feb. 28 2003 the web site Bet
on Sports gave the following odds for the timeframe in which the
United States will launch an attack (an attack requires a minimum of
500 military units).
March 3-9: 2 to 1
March 10-16: 3 to 2
March 17-23: 7 to 4
March 24-30: 5 to 1
March 31 or after (but before Dec. 31, 2003): 3 to 2
DISCUSSION QUESTIONS:
(1) How do you think we should understand Mr. Steiner's phrase "a thousand-year event" ? Has there been such an event in Florida (or anywhere else?) in the last thousand years? Should we not expect one for a thousand years? Or what?
(2) The tragic Columbia mission was the 113th shuttle launch. Along with the Challenger, this makes two catastrophic failures. Do you think this is inconsistent with the 1-in-145 estimate cited in the article? what about 1-in-245?
(3) In a passage relevant to the last question, the Post writes:
Moreover, because the shuttle flies so infrequently,
easy judgments are impossible to make. Mike Stamatelatos, manager of
risk assessment at NASA headquarters, said two accidents in 112 flights
"does not work" as a statistical model. He compared the accident rate
to a man who wins $10 in the lottery on the first try, then loses the
next two times.
What do you think of this analogy?
Answers to John Haigh's UK Lottery questions.
(A) Number 38 arose 113 times: Number 13 arose 70 times.
(B) 262 draws were needed: we would expect a mean of about 219.5 and
standard deviation of 61, using standard assumptions.
(C) It took 26 draws, against a theoretical mean of 35.08, for main
numbers to arise at least once. With 1176 pairs and 15 pairs in each
draw, ignoring the dependence within a draw, we would expect about 600
draws to complete the collection: it took 591. (Only 357 draws were
needed for every pair to arise, if the Bonus number were also counted.)
(D) Number 28 appeared in the 5 draws 283-287. On six other occasions
some number has made 4 consecutive appearances. No surprise here.
(E) 107 occasions.
(F) Modal number is 2 (150 times), with 1 (149) close behind.
(G) n = 17
Copyright (c) 2003 Laurie Snell
This work is freely redistributable under the terms
of the \GNU General Public License published by the Free Software Foundation.
This work comes with ABSOLUTELY NO WARRANTY.
CHANCE News 12.01
1 January to 28 February 2003
|