Given the widespread use of public opinion polls, I was interested in determining what people thought about them, and how knowledgeable they were about the nature of polls. I expected that the level of knowledge would influence attitudes toward polls and possibly behaviors.
The first publicized pre- election poll took place during the 1824 Andrew Jackson - John Quincy Adams presidential contest (Crossen, 1994). Since then, polls have expanded to capture public opinion on every conceivable topic. Today all major politicians engage the services of polltakers, and President Clinton has four working for him (Wines, 1995). Unfortunately, polls have evolved from a reflection of public opinion to an influence on policy. Shribman (1994) argues that polls dictate which issues dominate politics, and have replaced judgment and leadership in the current presidency. Some may counter that the will of the people thus prevails. However, do polls truly represent the thoughtful opinions and beliefs of the public?
Survey errors may arise from the questions themselves, sampling, interviewer characteristics and biases, even the time of day and season (Crossen, 1994; Moore, 1991). People may respond to questions on issues they know nothing about (Kinsley, 1995) or guess in self- serving ways (Crossen, 1994). Furthermore, questions demand quantifiable answers that are easy to analyze, losing the intensity and richness of opinions. Consequently, polls can "measure what people say. But only the most sophisticated measure what people really mean" (Yankelovich, 1994). Compounding the problem are the ways data can be manipulated, and how results are reported, failing to disclose the entire poll, sample size, and demographic information.
Despite polls' apparent misuse and inability to capture true opinion, some studies have shown support for their credibility. Kaplowitz, Fink, D'Alessio, and Armstrong (1983) found that on low commitment issues subjects were influenced by bogus consensus information, whereas they were not affected when they felt highly committed. I suspect that several factors could account for this result. For instance, lacking a strong opinion, people may take the majority viewpoint, trusting polls to give accurate information. Or perhaps an individual's level of commitment is related to one's understanding of the issue, so that a person with little knowledge on a topic will rely on the consensus opinion. Alternatively, informational social influence or normative pressures might explain the finding. Crossen (1994) proposes that polls actually form opinion; people look to them to see who and what to believe. It is reasonable to assume then that people do trust polls somewhat. Crossen (1994) commissioned Gallop to survey people on their attitudes toward information. Of the 1000 respondents, 63% were confident in the truth and accuracy of consumer surveys, 54% had confidence in public opinion polls, and over 80% said that statistics and scientific research increased a story's credibility. Yet, respondent's were "skeptical about information; agreeing that there are scientific studies to prove just about anything you want to prove" (Crossen, 1994, p. 36).
Given the proliferation of public opinion polls and the mixed feelings about them, I decided to investigate the role of knowledge about poll characteristics and procedures. I hypothesized that attitude towards polls was a function of people's knowledge of them. Moreover I predicted that the influence of opinion polls on a person's behavior was a function of the individual's knowledge about the nature of polls. Intuitively I expected an inverted U- shaped curve would result for each graph.
To test my hypotheses, I administered a survey to 24 students in an evening speech class at Normandale Community College (see pp. 12- 14). Participation was voluntary and uncompensated. The two- part survey had been protested by another adult to insure clarity of instructions and contents. The first section measured respondent's general knowledge about polling characteristics and procedures with an 18 statement true- false formatted quiz. The items were terminology and characteristics of polls that had been abstracted from Moore's (1991) textbook, and made into true or false statements. To prevent correct guessing that could distort subjects' scores, a don't- know option was included, and students were given written and verbal instructions to indicate DN rather than to guess wildly.
The second section of the survey contained 13 statements to which participants indicated their level of agreement on a seven point Likert- type scale, 1 showing strong disagreement and 7 signifying strong agreement. Seven of the items (B,D,E,F,H,J,K) denoted general attitudes toward polls, four statements (A,C,G,L) determined polls' influence on behavior, item I indicated attitude toward participating in a poll, and M reflected an opinion on politician's use of polls.
Each completed survey yielded five scores/ratings: total number of correct responses on the T- F test, an average level of agreement for both the attitude and behavior subsections, and an agreement score for both the participation and political usage statements. To maintain consistency such that 1 signified strong disagreement and negative attitude and 7 indicated strong agreement and positive attitude, items D,E,H, and K were reverse scored. One survey was returned incomplete, so 23 were scored and analyzed.
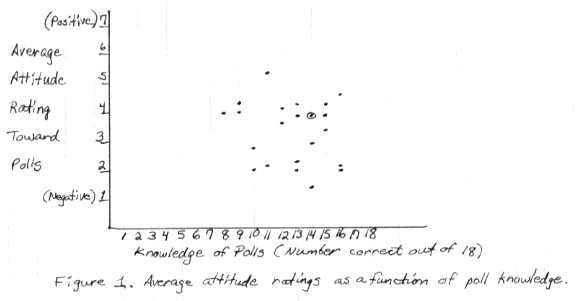
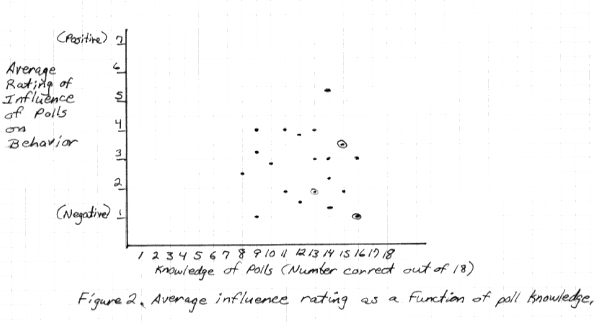
Average attitude ratings were plotted as a function of poll knowledge (see Figure 1). As no discernible pattern was evident (the data were truly scattered), no further analysis seemed warranted. Figure 2 shows the influence of polls on behavior, plotted as a function of poll knowledge. Here too, no pattern emerged, so no further analysis was done.

Though not relevant to my hypotheses, I believed that closer examination of each of the five scores/ratings would be interesting, if not insightful. Figure 3 depicts the frequency of test scores. The range was 8 - 16 correct (of 0 - 18 possible ), both median and mode lie between 13 and 14, and the mean was 12.7. Figure 4 describes the relative frequency of average attitude ratings. Divided into intervals, the ratings ranged from 1.4 - 5.4, mean of 3.4, and standard deviation of 1. The relative frequency of average influence scores are shown in Figure 5. Of the possible 1 - 7 range, the actual was 1 - 5.3, mean 2.7, and standard deviation was 1.1. A curve fitted to this figure would be bimodal and somewhat positively skewed.
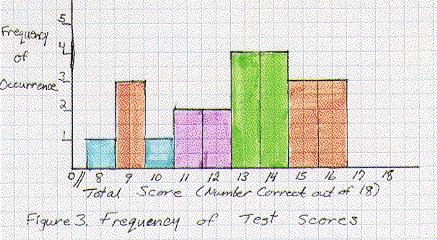
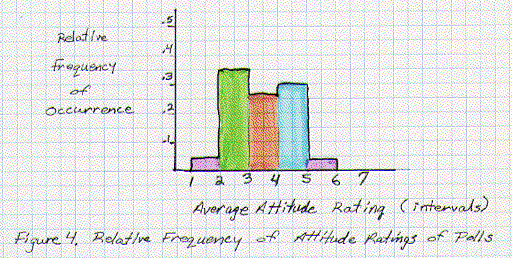
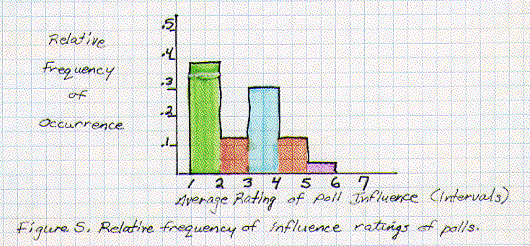
Figure 6 depicts the relative frequency of responses to the poll participation statement (I). The most frequently occurring (30%) response indicated strong disagreement with taking part in opinion surveys, whereas the least occurring (4%) response showed strong agreement to participation. Yet, the total distribution was more balanced, with 48% negative responses, 34% positive, and 17% unsure/no opinion. Item M stated that politicians should be less concerned with polls and more concerned with making informed, independent decisions. Figure 7 describes the relative frequency of agreement ratings to this item. Almost half (48%) of the students strongly agreed with the statement, a total of 70% showing some level of agreement. In contrast, no one strongly disagreed, only 13% disagreed at any level. Means and standard deviations are not reported for items I and M because I felt the results were best represented by figures.
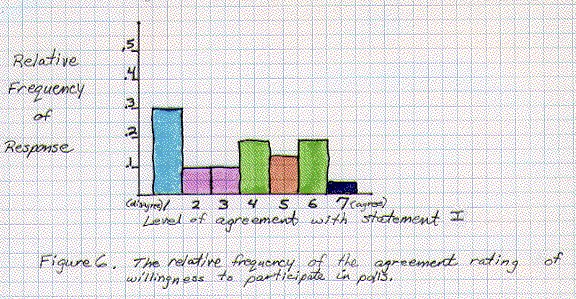
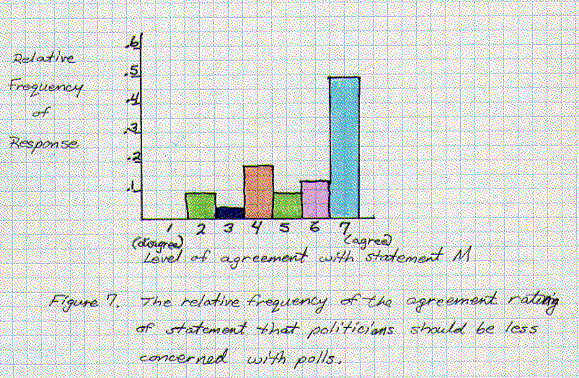
As Figures 1 and 2 indicate, no support for either hypothesis was found. No pattern or slope emerged that demonstrated any relationship between knowledge of polls and either attitude or behavior. Scores on the T- F test tended to be higher rather than lower, signifying a good overall understanding of the nature of polls. Participants had generally moderate attitudes toward polls, though more negative than neutral or positive. This contrasts with Crossen's (1994) finding of 54% confidence in polls, although my survey was broader in scope, perhaps eliciting more dislike. In ratings of whether polls would influence their behavior, more students responded negatively, and more intensely negative than attitude ratings. Thus most people's behavior is not influenced by poll information. Items I and M generated extremes in ratings. For the most part, people don't express a willingness to respond to public opinion surveys, and they definitely want politicians to be less concerned with polls. Due to the small sample size, and the brief survey, none of these findings can be generalized to the population.
Although my hypotheses were unsupported, I have not totally abandoned them. If I were to continue studying this topic, I would limit my hypothesis to the relationship between attitudes toward polls and knowledge of the nature of polls. I would use a larger sample, control for general attitudes and moods, and use subjects from both day and evening classes. Furthermore, I would eliminate the behavioral scale, add more attitude assessment statements, and expand the T- F section to 25 items. Finally, I would also include items that measured attitude in a more subtle way than direct statements of trust and confidence.
The other results can be attributed to any number of factors and would be interesting to investigate by themselves. For example, what are the determinants of the negative tendency in attitude, and the unwillingness to respond to polls? These side issues demonstrated to me an intriguing aspect of research, that looking at data in different ways (here, isolating certain ratings) can spark interest in new directions. I've also learned that hypotheses exist in a cycle of testing and refinement. I would advise future students to give themselves enough time, be flexible in their plans, and learn from discouraging results.
Crossen, C. (1994). Tainted truth: the manipulation of fact in America. New York: Simon & Schuster.
Kaplowitz, S.A., Fink, E.L., D'Alessio, D., & Armstrong, G.B. (1983). Anonymity, strength of attitude, and the influence of public opinion polls. Human Communication Research, 10, p.5- 25.
Kinsley, M. (1995, February 6). The intellectual free lunch. The New Yorker, p. 4.
Moore, D.S. (1991). Statistics: concepts and controversies. New York: W.H. Freeman & Co.
Shribman, D. (1994, May 29). Leadership by the numbers: having brought polling to new heights, will the Clinton administration reduce government to a new low? The Boston Globe
Wines, M. (1995, May 7). Feeling down? How about a new pollster? The New York Times, p.1.
Yankelovich, D. (1994, September 17). What polls say- - and what they mean. The New York Times, p.23.
My name is Margaret McCalla. I am a Normandale graduate, now a senior at the University of Minnesota. For one of my classes, I am developing a survey and need your assistance. All responses will be kept confidential. Thank you for your participation.
For each statement decide if it is true or false, then circle the appropriate letter. Or circle DN if you don't know. PLEASE DO NOT GUESS.
T F DN 1. The fewer people being polled, the more accurate the results, because with less people extreme responses are unlikely.
T F DN 2. Pollsters can phrase questions to elict certain responses.
T F DN 3. Surveys used to determine product satisfaction are generally not as accurate as those that are used to determine political opinion.
T F DN 4. The timing of a survey can affect its results.
T F DN 5. In trying to determine President Clinton's approval rating, it is just as accurate to poll 3000 people in one city as it is to poll 3000 people from varying regions.
T F DN 6. A phone- in poll in which people dial an 800 or 900 number to express their opinion will usually give more accurate results than a poll in which people are called and asked questions.
T F DN 7. Margin of error refers to the accuracy of the poll.
T F DN 8. Selective sampling is better than random sampling in obtaining results that reflect general public opinion.
T F DN 9. A possible problem with polls is that some people will lie rather than give an honest answer that may reflect poorly on them.
T F DN 10. Exit polls taken at voting sites can, if the results are broadcast, affect the voting behavior of those who have not yet voted.
T F DN 11. If a poll surveys a large enough sample of people, the results will have a high level of accuracy regardless of other factors.
T F DN 12. A 95 % level of confidence means that the probability of the poll being accurate is 95 %.
T F DN 13. Mail surveys are generally more reliable than phone surveys or personal interviews.
T F DN 14. The more people being polled , the better, because a large sample is more representative of the population.
T F DN 15. The larger the margin of error, the more accurate the poll.
T F DN 16. A potential problem with polls is that people may not have thought about an issue until the poll taker asks, so their response may be hasty and uninformed.
T F DN 17. Polls on public issues reflect the general public's opinion better than the letters politicians receive for or against the issue.
T F DN 18. A good, random sample of 1,000 people is just as good in representing a population of 30,000 as it is for a population of 5,000.
Please circle the level of your agreement or disagreement with each of the following statements according to this scale.

1 2 3 4 5 6 7 A. If a pre- election poll predicted that my chosen
candidate would lose by a large margin, I might not bother to vote.
1 2 3 4 5 6 7 B. I think that opinion polls are generally accurate.
1 2 3 4 5 6 7 C. I would try a product again that I previously did not like, if a poll showed it to be extremely popular.
1 2 3 4 5 6 7 D. I have a generally negative feeling about polls.
1 2 3 4 5 6 7 E. I think most polls are manipulated to show a certain desired result.
1 2 3 4 5 6 7 F. I think polls are a good source of information about public opinion.
1 2 3 4 5 6 7 G. If I am not sure for whom to vote, I might vote for the candidate who is ahead in pre- election polls.
1 2 3 4 5 6 7 H. I am suspicious of poll results.
1 2 3 4 5 6 7 I. If a poll taker phones me, I am more likely to answer questions than refuse to participate.
1 2 3 4 5 6 7 J. I have a generally positive feeling about polls.
1 2 3 4 5 6 7 K. In general, I don't think pre- election polls are good predictors of election results.
1 2 3 4 5 6 7 L. If I am undecided how to vote on a referendum issue (e.g., should we increase the sales tax? or should we have curfew laws for minors?) I might vote the way that has been the most popular in polls.
1 2 3 4 5 6 7 M. I think politicians should be less concerned with polls and more concerned with making independent yet informed decisions.