

Next: Regression to the
Up: CHANCE
Previous: Heart study
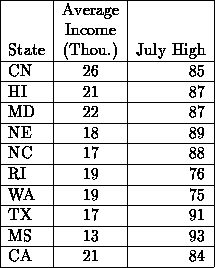
Look at the following data. Is there a relationship between the
average high temperature for July and the per capita income for the
state? If there is such a relationship, try to make a chart that
expresses that relationship as clearly as possible. When you're done,
copy your chart on the blackboard and pick somebody out to explain
it. If there is a relationship, why do you think it happens?

Talk about some combination of the following things that interests
you:
- See if you can figure out whether your odds are fifty-fifty
or better on the ``teaser bet'' now that it's been explained
more clearly.
- Read the Scientific American article about genetics
and the mind. How does it affect your opinion of the video
that I hope I was able to show you?
- If you think that authors of the paper on streaks in
basketball should have taken into account other factors
that they left out, tell me how that could have affected
their results.


