 ).
60 is two hundred percent of 30. (
 ).
).
SCI199Y: October 3, 1995
Percentages and percentiles
 ).
60 is two hundred percent of 30. (
 ).
).
In the news this week...
Required for next week
Project 1 continued
The graphic that I chose is taken from the Annual Report on International Statistics, Volume 2, 1995. This report is published by the International Statistical Institute, Voorburg, The Netherlands and provides an overview of recent activities of international statistical associations. The article in which this graph appears is ``The internet and statistical educators'' by T. Arnold, (pp. 9-10). It shows the amount of information transferred over the internet from November 1992 to January 1995, categorized by type of interaction. In addition to the generally increasing trend in use of the internet, it is striking that the use of the world wide web has been increasing much more quickly: as of January 1995 more bytes were transferred using the web than any other method of internet access except ftp-data transfers.
The graphic is rather poorly drawn and reproduced, so the central message
is obscured. The circles plotted for each data point are an example of
what Tufte calls redundant data ink, and are visually distracting. The frame
around the graph is ``chartjunk''. The source of the data should be
indicated in the legend of the figure, where it would not distract from
the message of the data. The five categories of internet usage could be
coded with different line types (or different grey scales) to give a more
pleasing and clearer picture. A conversion of the scale of the  -axis to
bytes would be more informative.
The Monty Hall problem continued
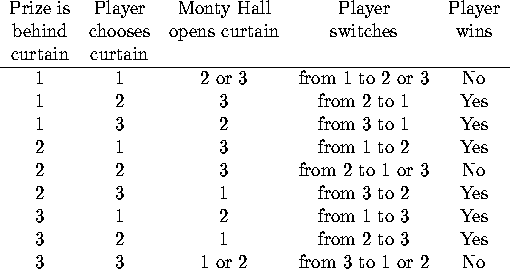
The correct solution, assuming that Monty always opens a door that does not have the prize (and this is a crucial assumption), is to switch. You have 2/3 chance of winning if you switch, and 1/3 chance of winning if you do not switch. Here is how the solution is laid out in Engel and Venetoulias (1991):

Reference Engel, E. and Venetoulias, A. (1991) Monty Hall's probability puzzle. Chance 4, 6-9.
This document was generated using the LaTeX2HTML translator Version 0.6.4 (Tues Aug 30 1994) Copyright © 1993, 1994, Nikos Drakos, Computer Based Learning Unit, University of Leeds.
The command line arguments were:
latex2html -split 0 lec4.tex.
The translation was initiated by Marie K. Snell on Thu Nov 16 15:03:41 CST 1995