 <<<========<<
!!!!!!!!!!!!!!!!!!!!!!!!!!!!!!!!!!!!!!!!!!!!!!!!!!!!!!

               CHANCE News 3.11
              (23 July to 10 Aug 1994)

!!!!!!!!!!!!!!!!!!!!!!!!!!!!!!!!!!!!!!!!!!!!!!!!!!!!!!!

Prepared by J. Laurie Snell, with help from Jeanne
Albert and William Peterson, as part of the CHANCE
Course Project supported by the National Science
Foundation and the New England Consortium for
Undergraduate Science Education.

Please send comments, suggestions for articles, requests
to discontinue your subscription etc. to:
jlsnell@dartmouth.edu

Back issues of Chance News and other materials for
teaching a CHANCE course are available from the Chance
Data Base which can be found on the Geometry Center
Mosaic (http://geom.umn.edu\) or Gopher (geom.umn.edu).
For Mosaic Chance is in the Multimedia Online Document
Library and for Gopher in Geometry Center Resources.

     =======================================
     Probability is so linked with statistics
     that, although it is possible to teach
     the two separately, such a project would
     be just a tour de force.

     E. Pearson  (1935)
     (Oral communication to J. L. Doob)
     ========================================
     IN THIS NEWS LETTER
>>>>>==========>> OTHER INTERNET SOURCES Stock Market Data and Stock Prices Have you ever wanted to have stock prices over a period of time to test for runs, correlations etc.? Well, now it is easy to do thanks to the M.I.T. Experimental Stock Market Data. You will find there the daily prices and volume for 333 stocks since Aug 30, 1993. These files are updated daily! You can get a plot of the prices and volume of trade from Aug 9 1993 to date for any of these stocks. The actual data for this period from which the graphs are made is also available. <<<========<<
>>>>>==========>> FROM OUR READERS Tom Moore writes that the Bagel problems mentioned last week was similar to the following baseball problem: "About the last day I was in Hanover there was an unassisted triple play in major league baseball -- the 11th in history. Don (Bentley) asked how likely would it be that in about 10 decades of baseball history, that 6 of the 11 unassisted triple plays would have occurred in the same decade. In fact, this is the case: 6 occurred in the 1920's." (The player was shortstop John Vallentine on the Boston Red Sox in a game against the Seattle Mariners on July 8. Actually, this was only the tenth unassisted triple play in baseball history. ed.) DISCUSSION QUESTIONS: 1. How would you use Feller's stars and bars argument to find the probability that, if there are 10 unassisted triple plays in a period of ten decades, there is some decade with six or more unassisted triple plays? Here we are assuming that each play is equally likely to fall in any particular decade. 2. Would this outcome lead you to reject at the 5% level the hypothesis that the unassisted triple plays in the last ten decades were equally likely to fall in any of the decades? 3. Some would say that such a test is not meaningful since the probability is 1 that this event occurs because we know that it did occur. Do you agree with this? <<<========<<
>>>>>==========>> Daniel B. Swearingen writes: Concerning Mr. Peterson's "Unscientific Polls": In a similar vein: Our local News weekly, the "Burtonsville [Md.] Gazette" puts forth two questions on current topical issues in each issue, invites the readers to phone in their agree/disagree or yes/no answers (via a 1-900 response line), and publishes the tallies the next week. Of course this is also an unscientific poll, and I've often considered writing to the editor suggesting that they include a disclaimer to that effect. It is interesting to note, though, that the responses are always posted without any commentary, editorial or otherwise. So, while the editorial staff doesn't discourage the drawing of important conclusions from the statistics (no disclaimer), they don't encourage it either (no editorializing). <<<========<<
>>>>>==========>> Yolanda Baumgartner, who reads strange journals that the rest of us never look at, suggested the following article from CAP Today published by the College of American Pathologists. <<<========<< From start to finish, how accurate are lab tests? CAP TODAY, July 1994, p 41 Peter J. Howanitz The author points out that the errors in measurement in lab tests are usually pretty well known and probably not the major problem in the overall accuracy of a laboratory test. To get an overall accuracy, he looked at data and tried to estimate the percent correct on several different factors that he feels determine the overall accuracy. He presents the following table: Steps Percent correct 1. Right test ordered 53.0 2. Order transmitted 97.1 3. Patient prepared 79.1 4. Patient identified 97.3 5. Specimen procured 93.2 6. Specimen acceptable 99.5 7. Measured Not included 8 Results transmitted 97.5 9. Results charted 96.6 10. Physician acts on results 47.1 He then considers 1000 patients and, at each step, cuts this number down by the appropriate percentage. Of the 1000 patients only 163 patients are predicted to have an overall accurate test that is acted on. (He even suggests other factors that cut it down further.) He then raises questions about whether this is a reasonable way to look at the accuracy problem and, if not, why not. DISCUSSION QUESTION If you have a lab test do your really think that you have only something like a 16.3 percent chance of a meaningful test? If not, what is wrong with the above analysis? <<<========<<
>>>>>==========>>
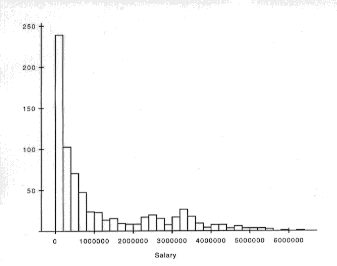
Jim Baumgartner caused a major problem for us by noting
that the newspapers continually talk about the average
baseball salary ($1,183,416 for 1994), but they never
say what the median is and Jim wondered what is was. We
finally found the 1994 salaries in the April 5 issue of
USA today. From this we found the median to be $500,000.
A histogram of the data shows clearly why there is such
a difference between the mean and the median. This
salary data can be obtained from the Chance Web database
using Mosaic or the Chance Gopher in "Teaching Aids".
<<<========<<
>>>>>==========>> Study finds more drug use but less concern about it.
The New York Times, 21 July, 1994, A18
By Joseph B. Treaster
The Department of Health and Human Services reports the
result of their annual survey on the use of drugs. The
survey consisted of more than 26,000 face-to-face
interviews.
A line graph, labeled "Percentage of people 12 or older
in the United States who used illegal drugs in the past
month", gives roughly these figures:
Year Percent
1979 13.8%
1982 12.2%
1985 11.6%
1988 7.4%
1990 6.3%
1991 6.2%
1992 5.46%
1993 5.59%
The article comments that the 13-year decline in the use
of illicit drugs has halted, and that the survey
suggests the drug problem might be on the brink of
worsening. It is stated that the survey had a margin of
error of less than plus or minus one percentage point.
The survey indicated that there was an increase from
1992 to 1993 in the use of drugs for Americans above 35
(7.5 million in 93 compared to 6 million in 1992) and
among teenagers (2.1 million compared with 1.7 million
in 1992). The survey suggested that in many age and
drug categories the fear of drugs was diminishing.
Some drug experts suggest that there is a "lack of
presidential leadership" on the drug problem.
Government officials such as Dr. Shalala, the Secretary
of Health and Human Services", denies this.
Discussion questions
1. How did the authors arrive at the margin of error of
less than plus or minus one percentage point?
2. Assuming the percentages given from the graph, is
the increase in 1993 over 1992 significant?
3. Can you conclude that the increases for subgroups of
people over 35 and for teenagers are significant even if
the overall drug rate has not increased significantly?
<<<========<<
>>>>>==========>>
The following letter from Mark Kernighan expressed his
opinions on this study.
Has drug-use study really told us anything?
The New York Times, 5 Aug 1994, A24
Mark Kernighan (letter to the editor)
A Federal study has shown that the number of Americans
who use illicit drugs rose from 1992 to 1993 (news
article, July 21). More precisely, the number of people
in a sample of 26,000 who were willing to admit their
drug habits to Federal researchers in door-to-door,
face-to-face, nonanonymous interviews grew by about 35,
or 0.13 percent of the sample.
The Department of Health and Human Services researchers
seemed to see no difference between drug users and drug
users who are willing to chat about it.
The rise is not even close to statistically significant.
Even if the drug rate were stable, 15 percent to 20
percent of all surveys would show such an increase just
by chance.
The Government's offhand disclaimer that the number of
heavy cocaine users "may be four times as high because
the survey does not reach many of the heaviest drug-
using groups" makes it clear that the vaunted 1 percent
margin of error of the researchers is as empty as the
wildest guess. The estimate is almost certainly too low,
because the interviewers are overlooking the heaviest
drug users, liars and subjects who don't answer the
doorbell.
Whatever the survey measures, it's not drug use. "If you
can't prove what you want to prove, demonstrate
something else and pretend that they are the same
thing," Darrell Huff wrote in his classic "How to Lie
with Statistics."
DISCUSSION QUESTIONS
How would Mark justify his statement: "Even if the drug
rate were stable, 15 percent to 20 percent of all
surveys would show such an increase just by chance."
Do you agree with Mark that the survey is not really
measuring drug use?
Do you agree with Mark that it is misleading to claim a
margin of error of 1 percent in a survey of this kind?
<<<========<<
>>>>>==========>> Here is a list of the articles in the Summer 1994 issue of Chance Magazine just out. "Small Cars, Big Cars: What is the Safety Difference?" by Leonard Evans. "Racetrack Bettings: Do Bettors Understand the Odds?" by Lawrence D. Brown, Rebecca D'Amato, and Randy Gertner. "Baseball: Pitching No-Hitters", by Cliff Frohlich. "Bricks, Buildings, and the Bronx: Estimating Masonry Deterioration", by William B. Fairley, Alan J. Izenman, and A Rhett Whitlock. "Consistence and Predictability of Football Results", by Haynes Phillips and Denise Phillips Wilburn In addition the various departments also have interesting chance discussions. We see from their department "From the Press" that we missed a couple of good articles! We particularly enjoyed Frohlich's discussion of no- hitters. There have been 202 no-hit games in the history of major league baseball, and Frohlich wonders how well simple probability models account for this number and other features of the distribution of no-hitters. He starts with a simple model that assumes batters and pitchers perform on each at bat with the same probability for success estimated from data. With this model, the number of no-hit games since 1900 is estimated to be only 135. His next model assumes that batters have the same ability but takes into account the variability of the performance of the pitchers. This model predicts 264 no-hitters. His third model adds variability in the hitting ability of the batters, but this adds only about 15 more no- hitters to the predicted number. Adding other factors, such as bias in scoring due to home team advantage, he is able to account pretty well for the observed 202 no- hitters. He admits defeat in explaining the large number of no-hitters in years 1990 and 1991 (eight in each years) and so he tentatively attributes this to chance. <<<========<<
>>>>>==========>> Study links weather fluctuations in Pacific to corn yields in Zimbabwe.
The Dallas Morning News, 25 July 1994, Discoveries, 7D
Sue Goetinck
A new study reported in a July 1994 issue of Nature has found that seasonal fluctuations in weather patterns over the Pacific Ocean are in step with Zimbabwe's corn yields the following year. For example, warmer temperatures from November to March meant poorer corn harvests the following season, while lower temperatures were associated with higher yields. Corn is Zimbabwe's most important food source, and the article suggests the possibility of forecasting crop conditions a year in advance. The link was discovered through analysis of Pacific weather patterns and corn harvests over the past 23 years, and, according to a related New York Times article, scientists "have established a statistical correlation of 'astonishing' strength...". Unfortunately, no precise figures are given. Dr. Cynthia Rosenzweig, an agronomist at Columbia University and New York's Goddard Institute for Space Studies, cautions that we shouldn't rely too heavily on such predictions until further studies have been done. As with most weather forecasts, "everyone takes them with a grain of salt." <<<========<<
>>>>>==========>> Deadliness of breast cancer in blacks defies easy answer.
The New York Times, 3 August 1994, pg. C10
Gina Kolata
According to this article, several recent studies
suggest that, although white women are more likely to
get breast cancer, black women develop more deadly forms
of the disease than white women. Many previous studies
have examined sociological factors, such as diet, income
and education level, and quality of available health
care, to explain the higher mortality rates among black
women; but no conclusive results have been obtained. In
fact, one current study cited in this article found that
"poor access to medical care... can account for only
about half of the increased mortality rate for black
women."
Other studies are described in which both groups of
women had equal access to mammograms and general health
care. Nevertheless, the black women tended to have
larger and more advanced tumors at the time of diagnosis
than the white women. Doctors admit that "glaring
inequities" still exist in quality of care, but the
higher mortality rate for blacks---in some studies as
much as twice the rate for whites---is now thought to be
due in large part to biological differences in the
cancerous tumors themselves.
DISCUSSION QUESTION: What do you think the statement
"poor access to medical care... can account for only
about half of the increased mortality rate for black
women." means?
<<<========<<
>>>>>==========>> The health care debate: finding what works; new frontier in research: mining patient records.
The New York Times, 9 Aug 1994, A20
Gina Kolata
The health care debate: finding what works;
new frontier in research: mining patient records.
The New York Times, 9 Aug 1994, A20
Gina Kolata
A new kind of medical research, sometimes called
"outcomes research", uses data from patient records,
drug stores, insurance companies, and hospitals to
compare performance of drugs, performance of doctors,
performance of hospitals etc.
The obvious biases in such research have made it
controversial. It is said that doctors often diagnose a
more severe condition than the patient has, to improve
the insurance situation. For example, since Medicare
does not pay for PSA screening for prostate cancer for a
healthy patient, such a patient might be recorded on the
insurance form as having this cancer.
The well known Oxford statistician Richard Peto says
that outcome research is pure "rubbish". (I guess this
remark was suggested by the famous expression from
computer science "garbage in garbage out"). However,
despite such concerns, this kind of research is thriving
and is felt to be an essential part of future health
care plans.
Carl Morris, chairman of the statistics department at
Harvard, feels that, with careful statistical analysis,
biases can be accounted for but that this is difficult.
He says: "What worries me is that things get
institutionalized before the best statistical methods
are set up. There's a tendency to gravitate towards
simple methods."
<<<========<<
>>>>>==========>> DNA tests provide key to cell doors for some wrongly convicted inmates.
The New York Times, 5 Aug 1994, A20
Gina Kolata
Two lawyers, Barry Scheck and Peter Neufeld, assisted by
18 law students, have established a project called the
"Innocence Project". This project reviews the cases of
convicts who they feel may have been wrongly convicted,
usually of rape or murder.
The project has assisted in the release of eight male
prisoners and have recently obtained evidence that three
other prisoners are not guilty of the crimes for which
they were convicted.
The projects pursued have three things in common: The
men were convicted based on identification by witnesses,
they were too poor to afford private lawyers, and any
forensic date introduced were flawed or inadequate to
establish the person's identity.
The Innocence Project was suggested to Neufeld when he
learning that one third of the time when DNA is used by
the F.B.I. it results in showing that the DNA of the
suspect does not match that found at the scene of the
crime. The work of the Innocence Project relies heavily
on the use of DNA fingerprinting.
Despite the success of the Innocence Project there are
many difficulties in reversing a case even with fresh
DNA evidence--re-consideration may not be allowed after
a certain time limit, district attorneys may not release
the evidence needed for testing etc.
Incidentally, Barry Scheck and Peter Neufeld are both on
the lawyer team for O.J. Simpson.
<<<========<<
>>>>>==========>> IQ fight renewed: New book links genes, intelligence.
The Boston Globe, 9 August 1994, p1.
Anthony Flint
Harvard psychologist Richard J. Herrnstein and political
analyst Charles Murray have co-authored a book entitled
"The Bell Curve: Intelligence and Class Structure in
American Life", which is due to appear this fall (Free
Press). The book argues that intelligence is largely
hereditary and therefore cannot be significantly changed
by outside influences. The analysis is based on
existing studies, including experiments on twins
separated at birth.
Herrnstein has said the book will also develop a link
between IQ and a range of social behavior, including
educational performance, welfare dependency and criminal
activity. He asserts that income distribution in the
U.S. strongly reflects the distribution of IQ. His
critics note that the validity of IQ tests as a measure
of intelligence has long been contested. Furthermore,
they fear that his arguments will inevitably lead to the
assertion that there are essential differences in
intelligence among racial and ethnic groups, which could
be then be used to rationalize their differential
standing in society.
<<<========<<
>>>>>==========>>
Census correction might aid big cities.
The Boston Globe, 10 August 1994, p11.
Associated Press
In 1991, Commerce Secretary (for the Bush
Administration) Robert Mosbacher decided not to use
statistical techniques to adjust the census. Even
though it was acknowledged that minorities suffered from
greater "undercounting" than whites at the national
level, Mosbacher sided with critics who said that the
proposed statistical techniques would not necessarily
provide sufficiently accurate assessments at the local
level. (See the Undercount in the 1990 Census profile in
the Chance database).
The government was sued by large cities who felt they
were being disadvantaged both in terms of Congressional
representation and in apportionment of federal funds.
But a 1993 court decision refused to order an
adjustment, ruling that the plaintiffs had not shown
that Mosbacher's decision was "arbitrary or capricious."
That ruling has now been overturned by an appeals court,
which has set a new standard: to refuse adjustment, the
government must show that such a decision is "essential
to the achievement of a legitimate government interest."
It remains to be seen if the Clinton administration will
try to defend the Bush administration's decision,
perhaps by an appeal to the Supreme Court.
<<<========<<
>>>>>==========>> Condoms are found to be a highly effective HIV barrier.
The Boston Globe, 11 August 1994, p9.
Richard A. Knox
A multinational European study--reported in the New
England Journal of Medicine and touted as the most
rigorous to date--finds that condoms, when used
consistently, are highly effective at preventing
heterosexual transmission of the HIV virus. The study
involved 256 couples from 8 countries, where one partner
was at risk of transmission from the other. It covered
two years and 15,000 episodes of intercourse. Among the
124 couples who always used condoms, there were no cases
of transmission. Among 121 couples who used condoms
sometimes or never, there were 12 cases of transmission.
(Eleven other couples declined to provide complete
information--but none were infected).
DISCUSSION QUESTIONS:
1. Is this an observational or experimental study? What
is the implication of the fact that the numbers in the
two groups are so nearly equal?
2. Can you identify any possible lurking variables?
3. The article mentions two previous studies on the
effectiveness of condoms, one of which involved subjects
who had many sexual encounters with the same partner and
the other where the subjects had a number of different
partners. The article mentions that it is difficult to
compare results in these two studies. Why would this be
true?
4. Assume that when a person chooses a partner there is
a probability p that this partner is HIV positive and,
if HIV positive, there is a probability r that it will
be transmitted on a particular sexual encounter.
Which gives the higher probability for becoming infected
with the HIV virus: Choosing a partner randomly from
the population and then having 100 sexual encounters or
having 100 encounters with partners chosen randomly from
the population?
<<<========<<
>>>>>==========>> Are placebos ethical? A debate is launched.
The Boston Globe, 11 August 1994, Medical Notebook, p3.
Richard A. Knox
Two Boston researchers, writing in the New England
Journal of Medicine, argue that it is unethical for
clinical trials experimenters to give volunteers a
placebo when there is an already existing treatment
known to be better than nothing at all. They write: "In
practice, FDA officials consider placebo controls the
'gold standard'. Placebo controls are, in effect,
required for studies of moderate severity and pain, even
when an alternative treatment is available."
DISCUSSION QUESTION: Are researchers who insist on
placebo controls simply insensitive to the human issues?
Can you think of any arguments in favor of placebo
controls in the situations cited here?
<<<========<<
>>>>>==========>> Studies link EMF exposure to higher risk of Alzheimer's.
Los Angeles Times, 31 July 1994, A3
Thomas H. Maugh II
Results from three new studies, two carried out in
Finland and one in Los Angeles, suggest that those with
a high occupational exposure to electromagnetic forces
(EMF's) are at least three times as likely to develop
Alzheimer's disease as those without significant
exposure. This is twice the risk that is typically
claimed for cancer.
The three studies involved a total of 386 Alzheimer's
patients and 475 healthy controls. Subjects were
divided into two categories -- those with medium to high
occupational exposure and those with low or no
occupational exposure. The relative risks for the three
studies were 2.9, 3.1, and 3 times higher for the high
exposure than for the low exposure group. For women the
relative risks were 7.3, 3.3, and 4.2.
This research grew out of laboratory findings that EMF's
increase the number of calcium ions (charged atoms) in
nerve cells grown in the laboratory.
DISCUSSION QUESTION
Are these results statistically significant?
<<<========<<
>>>>>==========>> Defending the earth against errant asteroids.
NPR, All things Considered, 20 July 1994
Interview with Carl Sagan, hosted by Robert Siegel
In this interview, Carl Sagan discusses the probability
that a good-sized comet or asteroid will collide with
the earth sometime in the future. He also estimates the
mortality rate associated with such an event and comes
up with some intriguing figures.
In his introduction, Mr. Siegel states that, "Chances
are, according to Sagan's reckoning, that the planet
Earth will collide with an asteroid as big as a
kilometer wide about every 500,000 years. An asteroid
that big would claim more than a billion lives, he says.
So, during the next century, the odds against such a
catastrophic collision are about 5,000 to 1." Siegel
then goes on to summarize Dr. Sagan's calculation of the
death rate: "He divides the billion-plus death toll by
a few hundred thousand years and calculates the very
approximate mortality rate of this catastrophe at about
3,000 deaths per year."
Although Sagan acknowledges that there are more pressing
dangers to earth's inhabitants, he believes that we are
capable of preventing such a collision using nuclear
weapons. Specifically, if a far-off asteroid is
expected to collide with the earth, a series of
explosions near its surface can change its orbit enough
to avert the collision. (He is worried, however, that
the weapons could also be used to cause such a
collision.) At the very least Sagan advocates a program
to search for all potentially dangerous objects,
"...plot their orbits and see if there's any one of them
that in the next years or decades or even centuries is
likely to hit the Earth."
DISCUSSION QUESTIONS:
1) What do you think the mortality rate of 3,000 deaths
per year means? Sagan says this is "not much, compared
to the dangers of smoking or dehydration." What do you
think he is comparing here?
2) According to an article in the last issue of Chance
News, (Comets hitting earth, rare but dangerous),
planetary scientist Clark Chapman says there is a 1 in
10,000 chance that a comet or asteroid more than a mile
wide will collide with the earth in the next century.
Does this agree with Sagan's estimate?
3) Chapman and Sagan both say that we need to find and
track the orbits of potentially harmful objects in
space, but Chapman thinks it would take 100 years to
discover most of them, and that there's a 90 percent
chance we'd have at most a few minutes warning before a
collision. If most of the asteroids and other large
objects are either unknown or untracked, how do you
think probabilities such as the 1 in 10,000 figure are
determined, and what do they mean?
<<<========<<
>>>>>==========>>
In defense of a little virginity; a message from Focus
on the Family
The New York Times, 7 August 1994, pg. E7
Advertisement
This is a full-page advertisement promoting sexual
abstinence for teenagers. It contains a plethora of
statistics on sexually transmitted diseases including
HIV and AIDS infection rates, abortions, and teenage
pregnancies. Some of these statistics are presented
under the heading: "These are the facts", with an
accompanying list of sources. In one case, ("1 in 100
students coming to the University of Texas health center
now carries the deadly virus" [HIV]), the corresponding
footnote states that the figures are from a study that
was "based on a non-random sample."
The format of the ad is a series of questions a
concerned parent might ask, followed by Focus on the
Family's responses. Not too surprisingly, some of the
responses don't quite answer the question, but instead
repeat the overall message that abstinence is the "only
healthy way to survive this worldwide epidemic". For
example, one question asks: "But if you were a parent
and knew that your son or daughter was having sex,
wouldn't you rather he or she used a condom?" The
response begins by citing a 1987 study of married
couples, one of whom was infected with HIV, which found
that 17 percent of the partners using condoms became
infected with HIV within a year and a half. "Telling
our teens to 'reduce their risk' to one in six (17%) is
not much better than advocating Russian roulette," the
ad reads. "Both are fatal, eventually. The difference
is that with a gun, death is quicker." The correct
answer here apparently is: Tell them to stop having sex!
DISCUSSION QUESTION:
What do you think of the Russian roulette analogy above,
and of the following, also included in the ad: "Suppose
your son or daughter were joining an 18-month skydiving
club of six members. If you knew that one of their
parachutes would definitely fail, would you recommend
that they simply buckle the chutes tighter?"
<<<========<<
>>>>>==========>> Battered-truth syndrome.
Washington Post, 31 July 1994, C1
Armin A. Brott
The author considers the many different estimates for
the number of battered women in the United States and
explains why they are all so different.
The National Coalition Against Domestic Violence
estimates that over half of the married women (0ver 27
million women) will experience violence during their
marriage, and more than 1/3 are battered repeatedly
every year. These are claimed to be estimates obtained
from battered women's shelters.
Donna Shalala, secretary of health and human services,
mentions the figure 4 million women battered each year
by their husbands. This came from a Harris poll in 1993
which apparently really estimated about 1.1 were
"kicked, bit, hit with a fist or some other object and
another 2.9 million were "pushed, grabbed, shoved or
slapped".
The biggest distortion of the number of battered women
occurred when talk show host Pat Stevens mentioned 60
million on an interview on CNN's Crossfire--more than
the number of married women.
The author feels that the most reliable estimate is
provided by the National Family Violence Survey
sponsored by the NIH. They found no violence in 84
percent of the American families. For the 16 percent
that do experience violence, most is in the form of
slapping, shoving and grabbing. Thus about 3 to 4
percent, or 1.8 million women are subject to "severe"
violence, with about 188,000 requiring medical attention
-- still, of course, grim statistics.
Another misleading statistic is that 95 percent of the
time women are the victims and men the perpetrators of
the violence. This figure comes from reports of
violence, whereas more reliable evidence suggests that
men and women are the perpetrators about an equal
percentage of the time.
The author discusses some of the reasons for this
distortion of the facts.
!!!!!!!!!!!!!!!!!!!!!!!!!!!!!!!!!!!!!!!!!!!!!!!!!!!!!!!
CHANCE News 3.11
(23 July to 12 Aug 1994)
!!!!!!!!!!!!!!!!!!!!!!!!!!!!!!!!!!!!!!!!!!!!!!!!!!!!!!!
Please send suggestions to: jlsnell@dartmouth.edu
>>>==========>>|<<==========<<<